Heron Building, Paris: 4,046 façade and roof photos located on a 3D model
On 29 September 2026 we photographed by drone the four façades and the roof of the Heron Building, a twenty-storey office building (ground floor to 19th floor) on avenue du Maine, in the 14th arrondissement of Paris. The mission produced 4,046 photos. The client wanted to record the defects itself, with a team whose members are not specialists in drone imagery.
Every photo in its place on the building
Four thousand façade photos all look alike: without a reference, there is no telling on which floor and in which bay a crack lies. So we delivered a web inspection interface in which every photo is positioned on a 3D model of the building. Clicking on the model shows the photos taken at that spot, and a photo can be projected onto the façade to check what it covers.
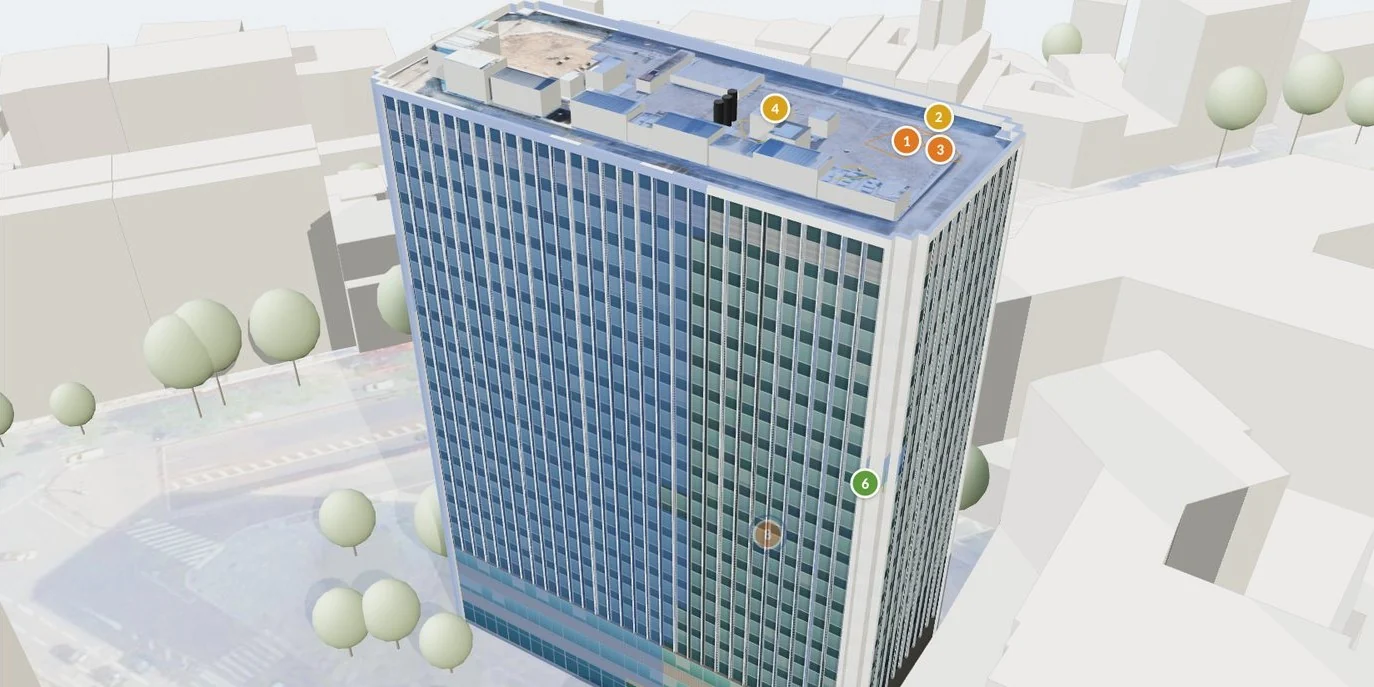
The building is divided into five zones: the four façades and the roof. On the façades, each photo is located by floor and by 1.70 m bay, 29 bays on the long façades and 11 on the short ones. The roof is gridded into 3 m squares, identified by a letter from A to S and a number from 1 to 8. A defect is thus located to within about one metre.
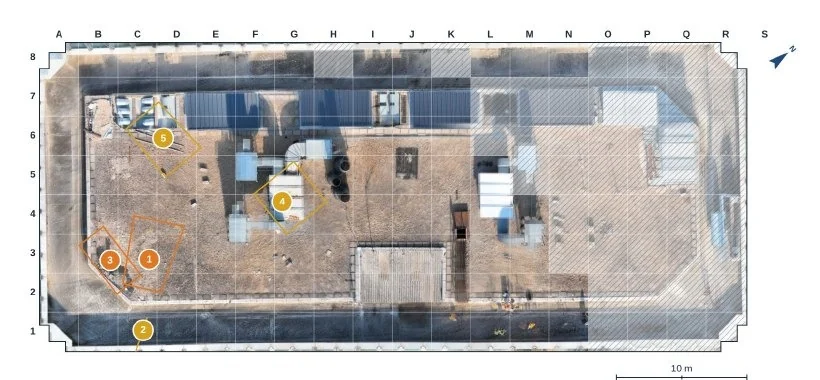
A shared survey, without duplicates
The tool leads the user zone by zone. A photo displayed for more than a second counts as examined and the matching part of the model turns blue: everyone sees what is left to look at, and the team can split the zones between them. To report a defect, the user draws it on the photo as a box, a line, a point or an outline, picks its type and severity, then adds a note.
Four severity levels are offered: minor, to be monitored; moderate, repair to be scheduled; major, to be dealt with in the coming months; urgent, a risk to people, to be reported at once. The types reflect what this building shows: rusted reinforcement, damaged waterproofing, cracks, blocked drains, metal corrosion, rubbish on the roof, dirt and moss.
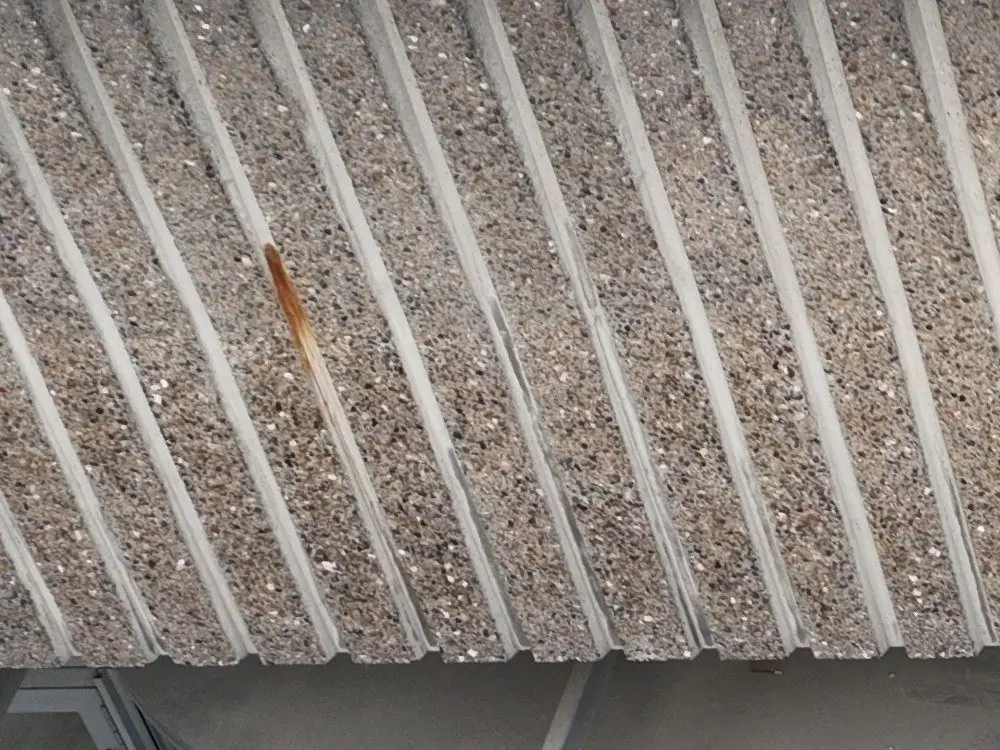
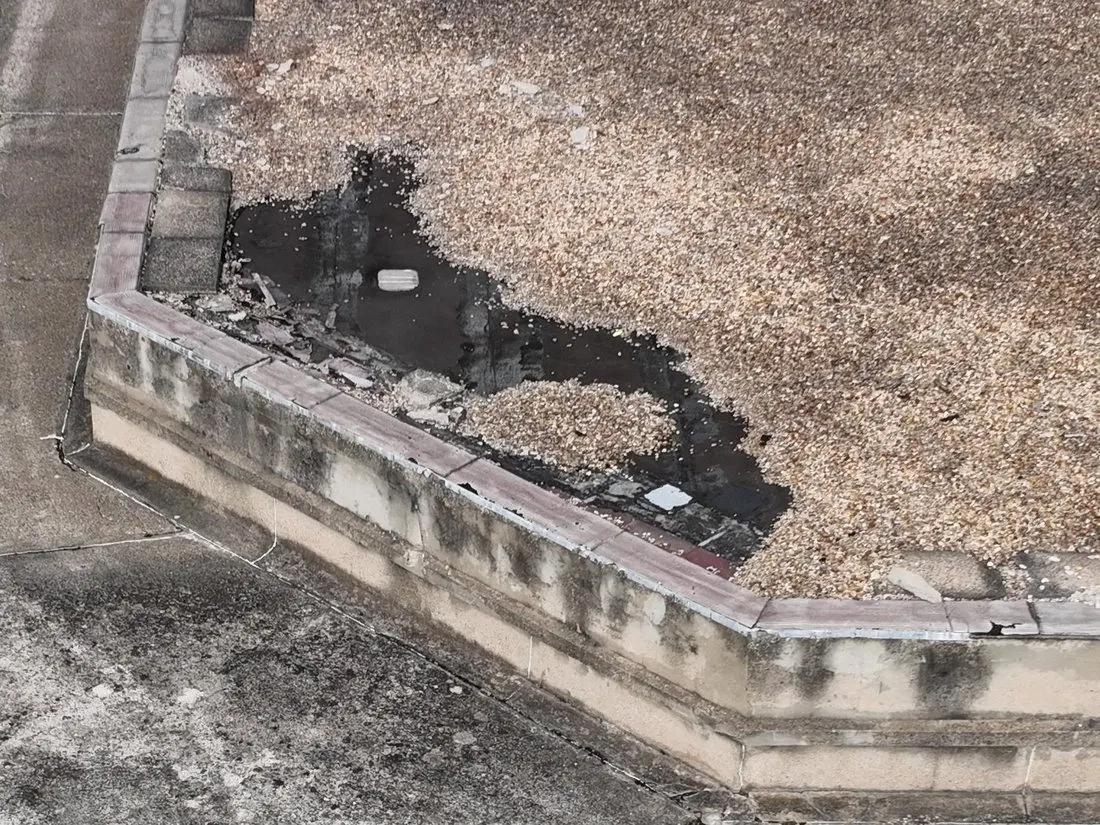
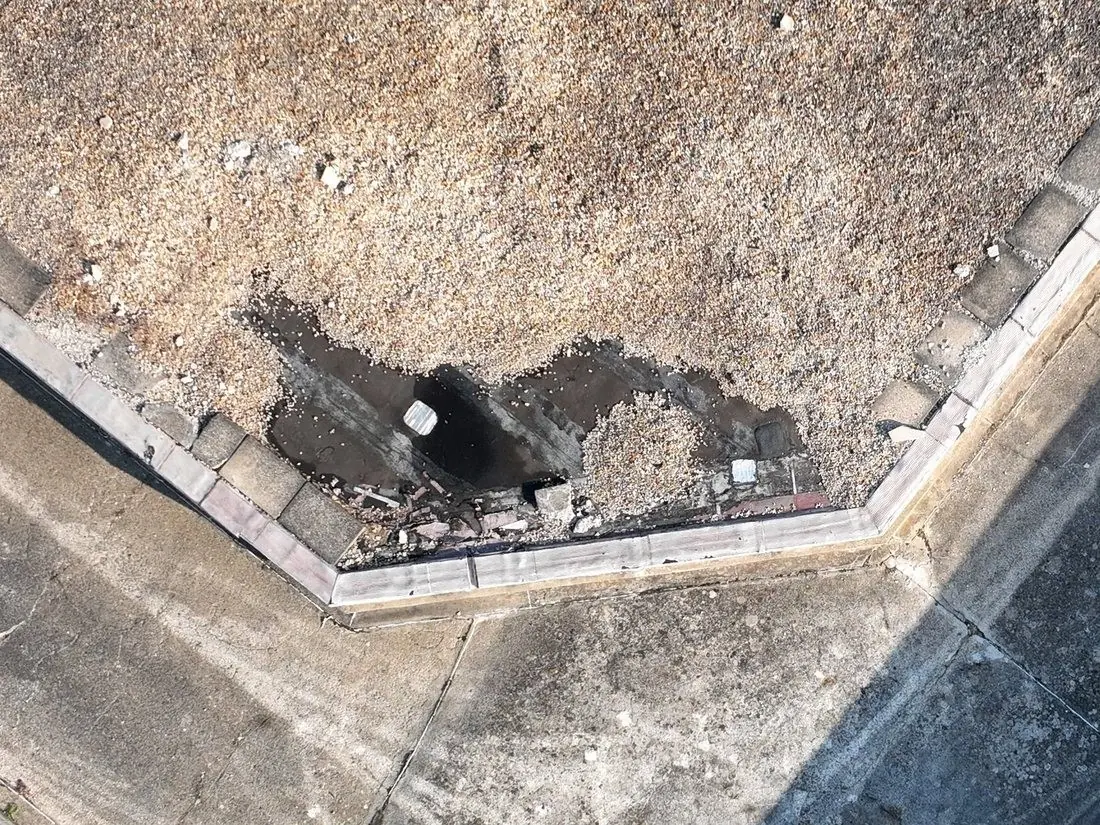
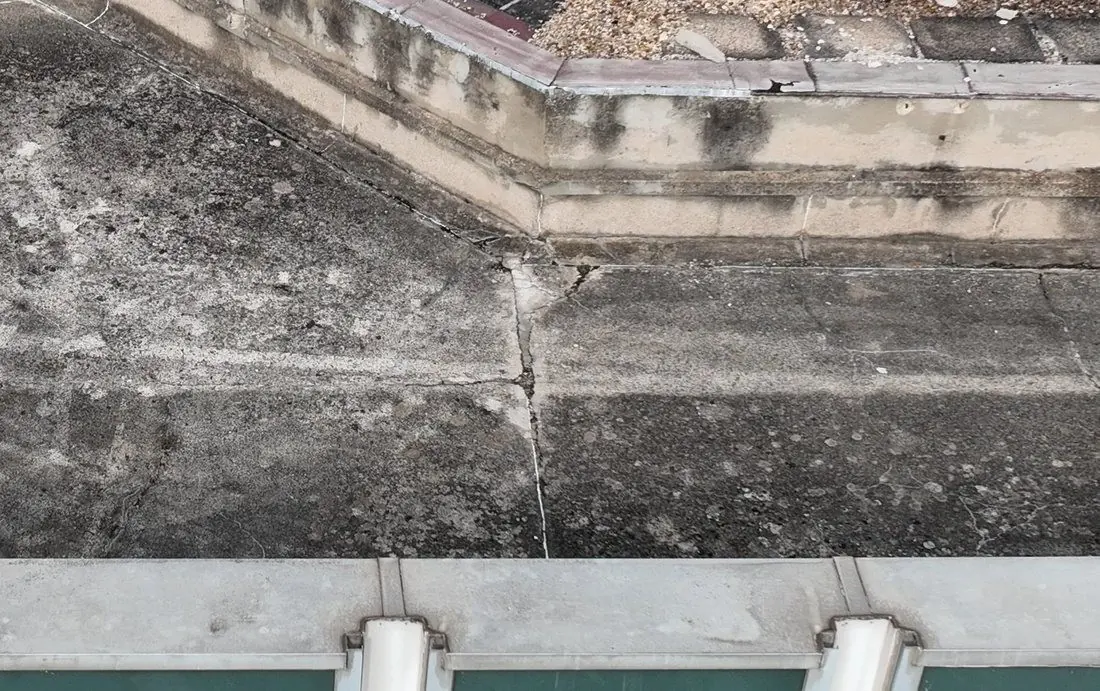
Each record is signed by its author and saved on a server shared by the whole team; edits and deletions remain traceable. If the network drops, entries wait in the browser and are sent once the connection is back.
What the client receives
At the end of the survey, the tool produces a printable PDF report: cover page, summary, façade elevations, roof plan and one sheet per defect with its photo. The same data can be exported as a CSV table and as GeoJSON for a GIS. A plan view, on an IGN map or an aerial photo, also shows the drone’s position for every shot.
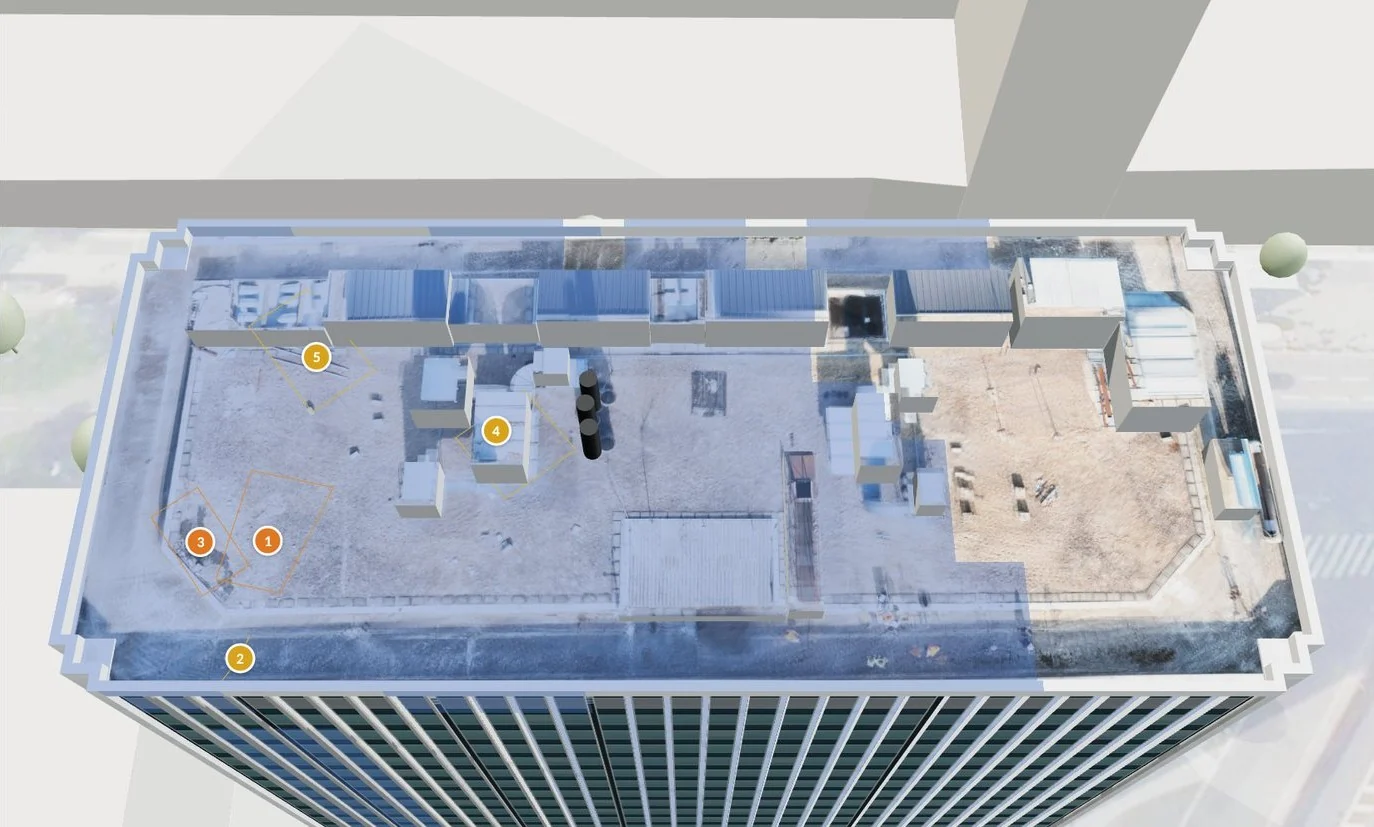
The same approach is used on the structures we inspect in Brazil, where every anomaly recorded on the dam faces is mapped on Sentinel Cloud.