
- Home
- Services
- Thermography
Drone thermography
Radiometric thermal images and visible images are captured during the same flight: each anomaly is located on the orthophoto, measured in temperature and classified in a report.
Applications
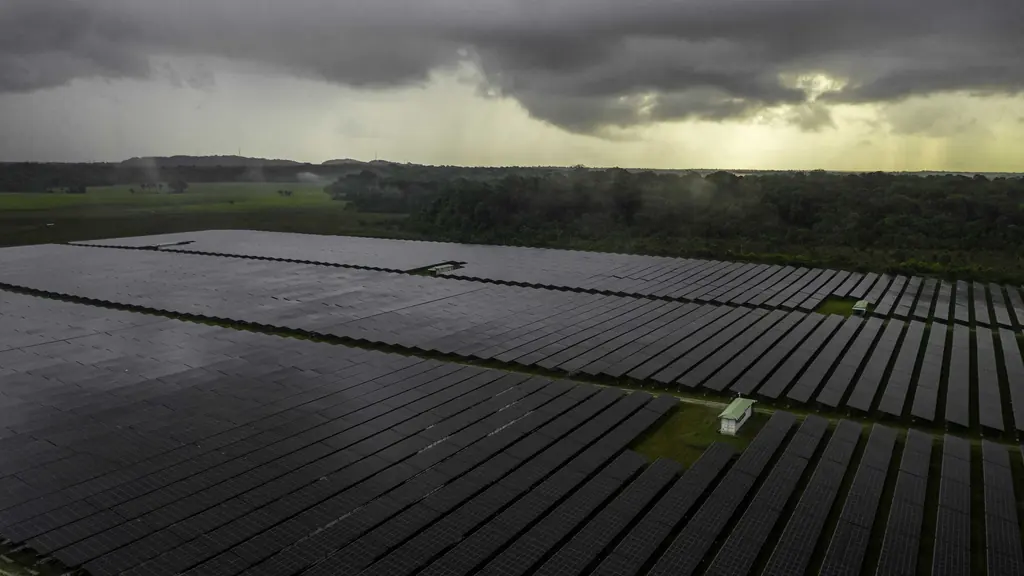
Aerial thermography covers entire installations in a single flight, without lifts or production stops.
Solar plants
Ground-mounted or rooftop: every module is checked, so maintenance targets only the faulty ones.
Buildings and roofs
Thermal bridges, water ingress, sealing and insulation defects.
Industrial installations
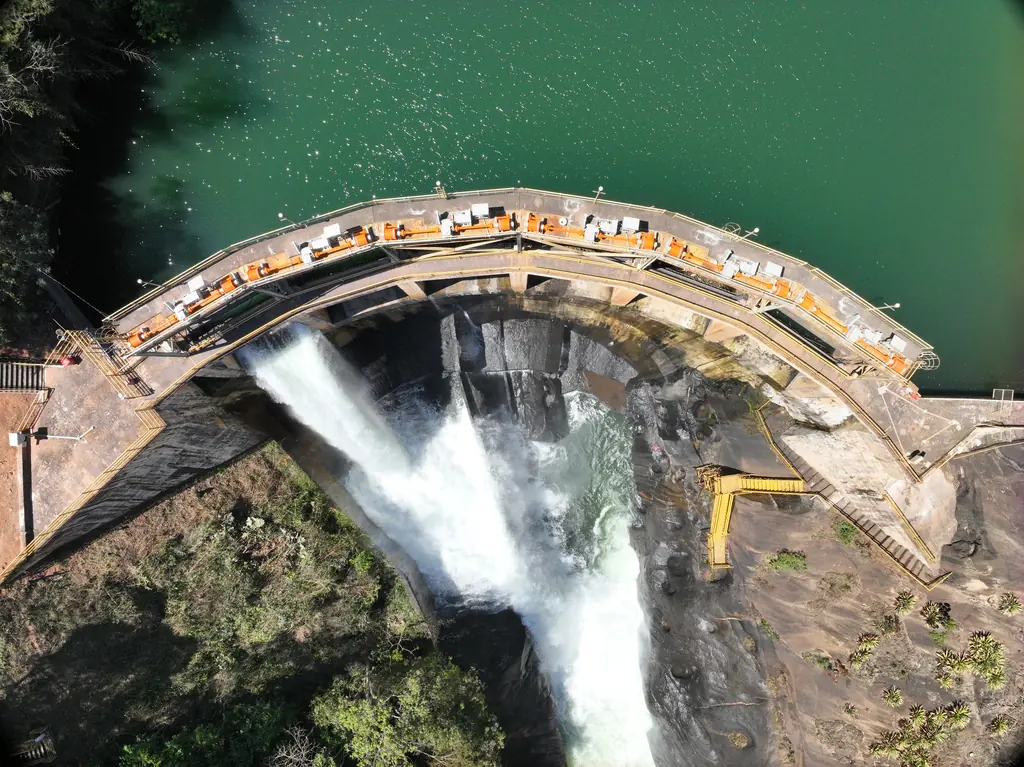
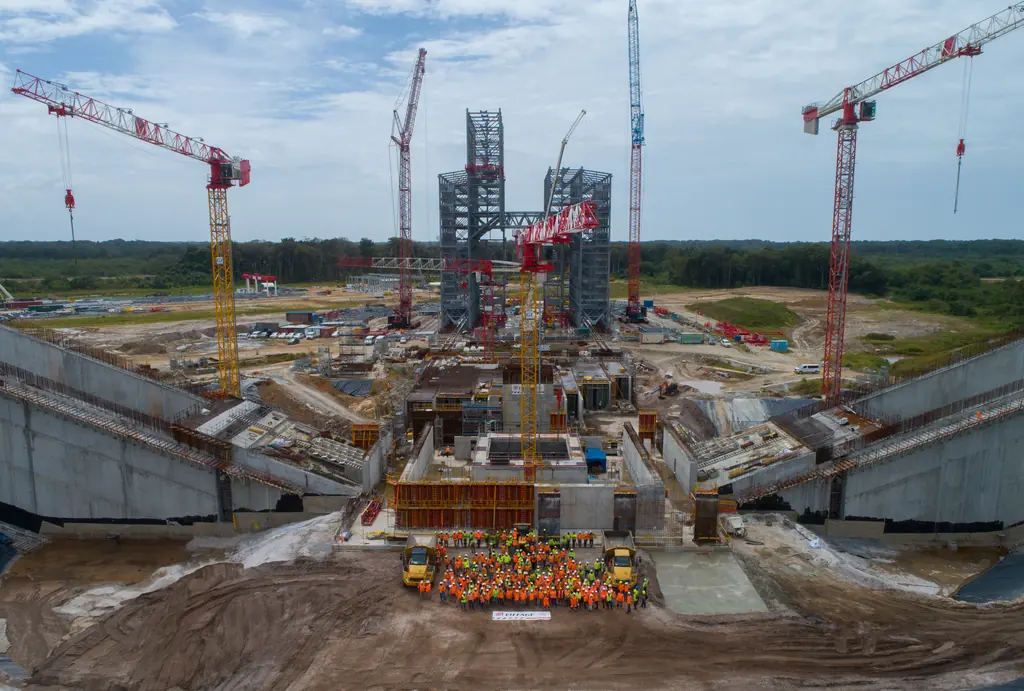
Electrical equipment, networks and abnormal heating, as during the check of the Ariane 5 launch pad igniters.
Defects detected on a solar plant
The thermal image, combined with the visible image and electrical measurements, helps trace the cause of each failure.
- Hot spots caused by damaged cells or soiling
- Faulty connections and overheating cables
- Failed bypass diodes and permanent shading
- Overheating junction boxes
- Potential induced degradation (PID)
A report everyone can read
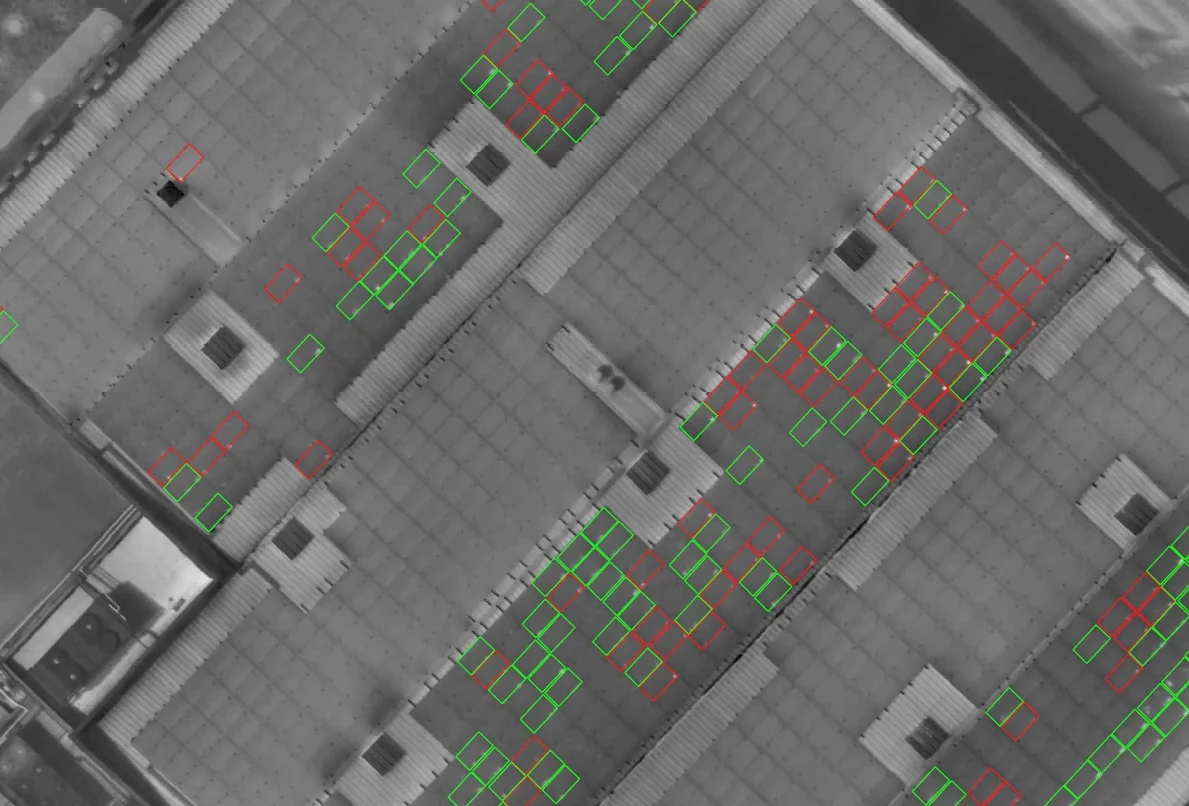
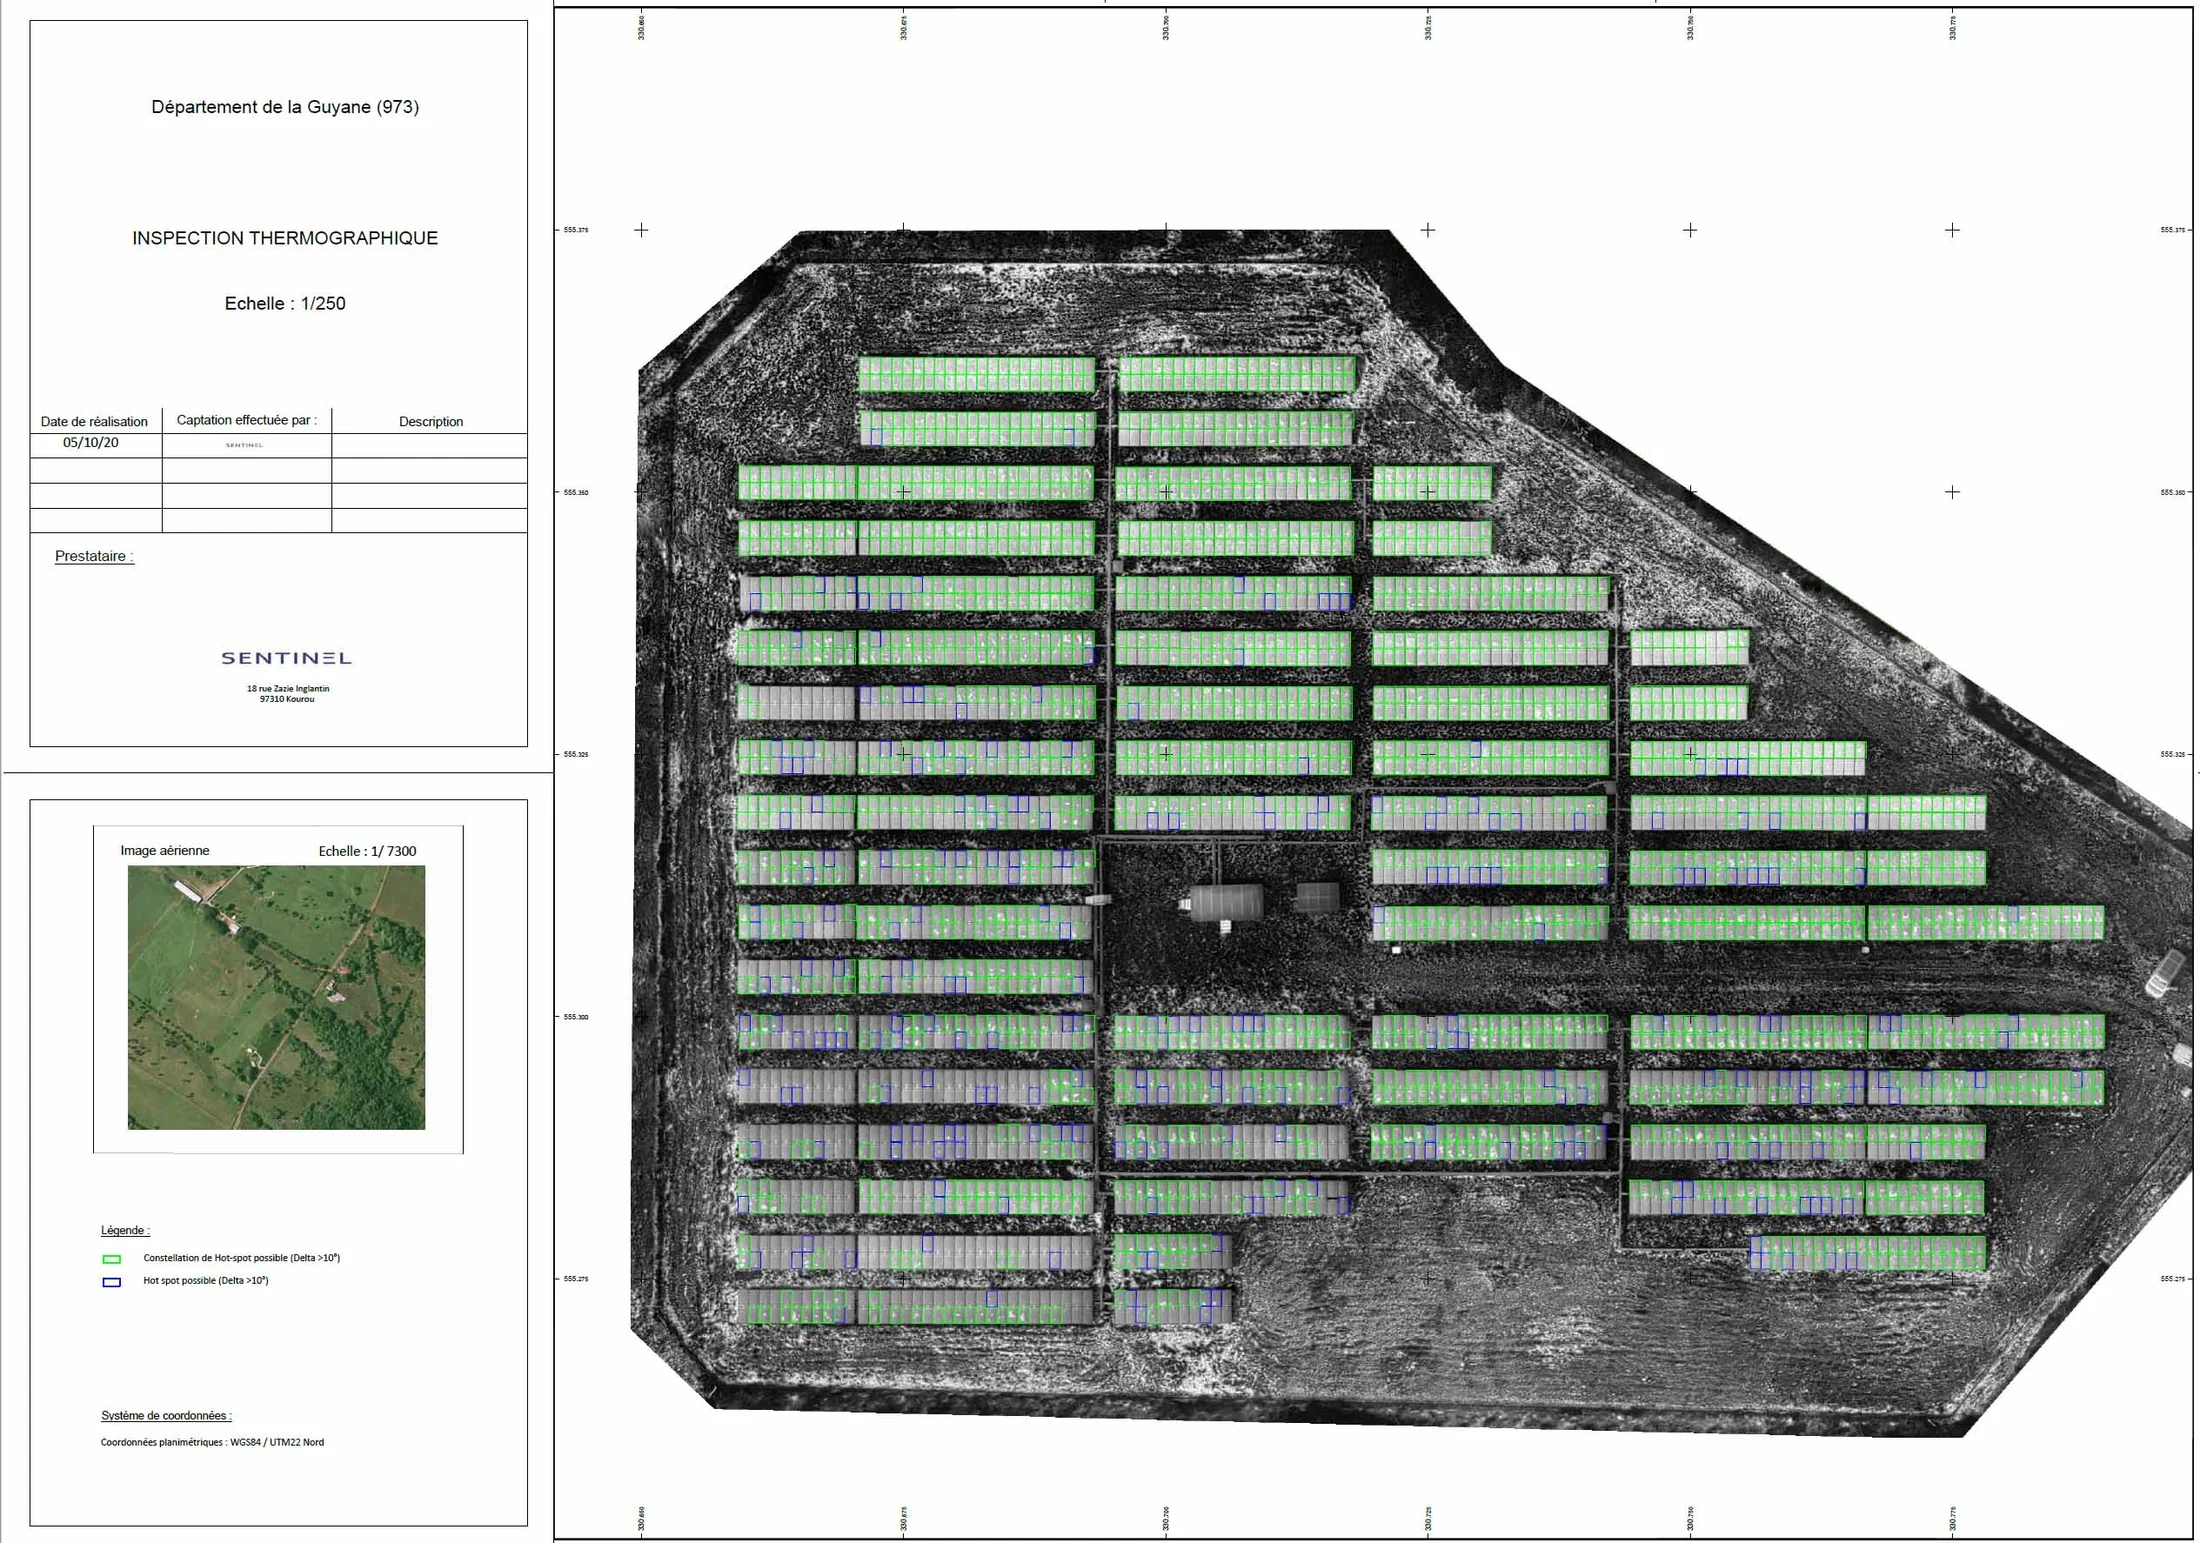
Each report opens with an overview of the condition of the plant, then details every defect: position, classification, temperature, comment and map extract.
Opposite, the summary of an actual inspection. The same data can be viewed and compared from year to year in Sentinel Cloud.
| Defect | Modules affected | % |
|---|---|---|
| Hot spots | 10 | 0,34 |
| Hot spot clusters | 18 | 0,62 |
| Possible diode fault | 0 | 0,00 |
| Possible string fault | 0 | 0,00 |
Deliverables
Georeferenced products, ready to feed into your maintenance tools.
| Radiometric orthophoto | GeoTIFF |
|---|---|
| Aligned visible orthophoto | GeoTIFF |
| Defect map | PDF, DWG |
| 3D model of the plant | OBJ |
| Analysis report and indicators | |
| Viewing and multi-year monitoring | Sentinel Cloud |
Gallery
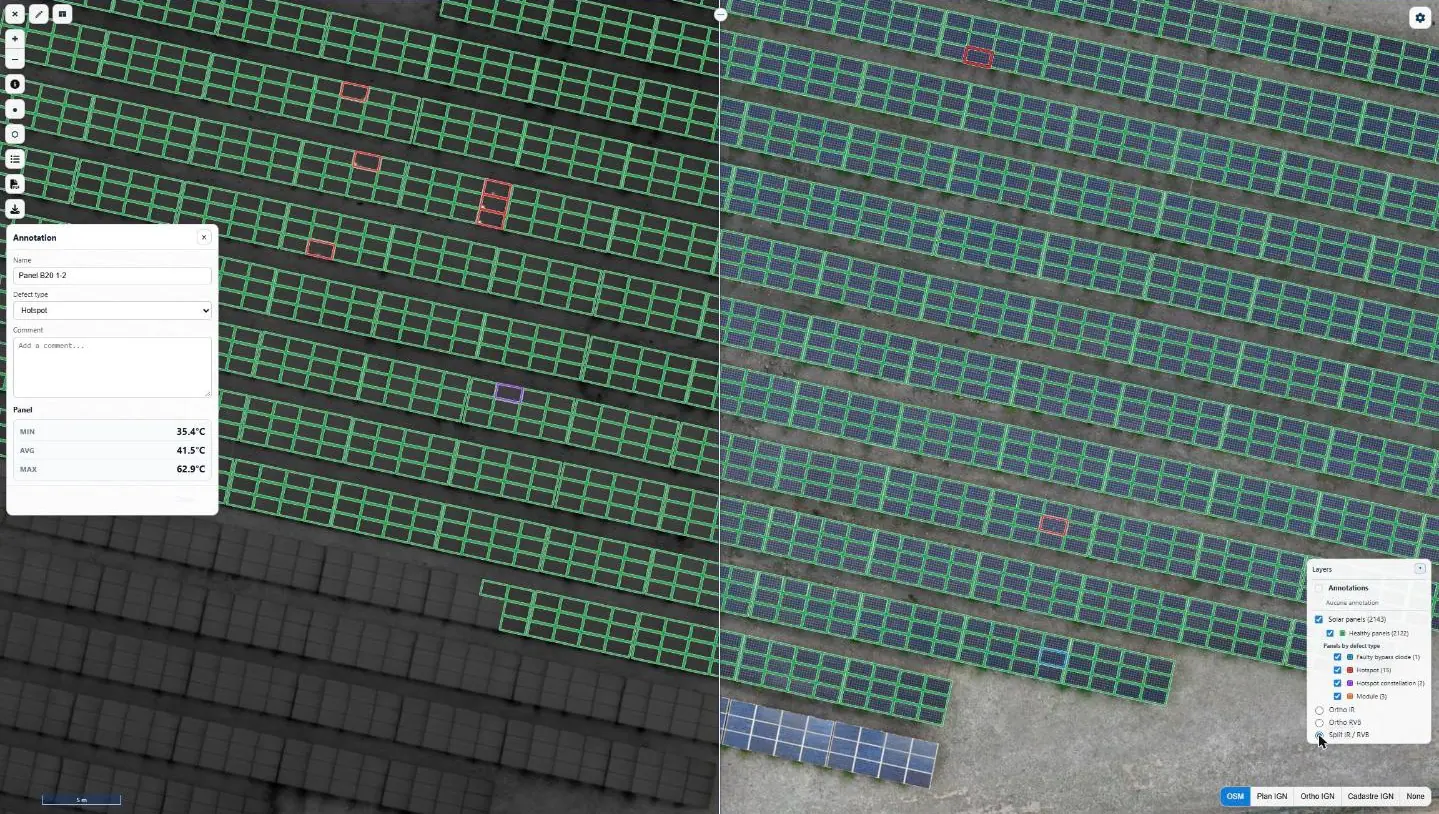
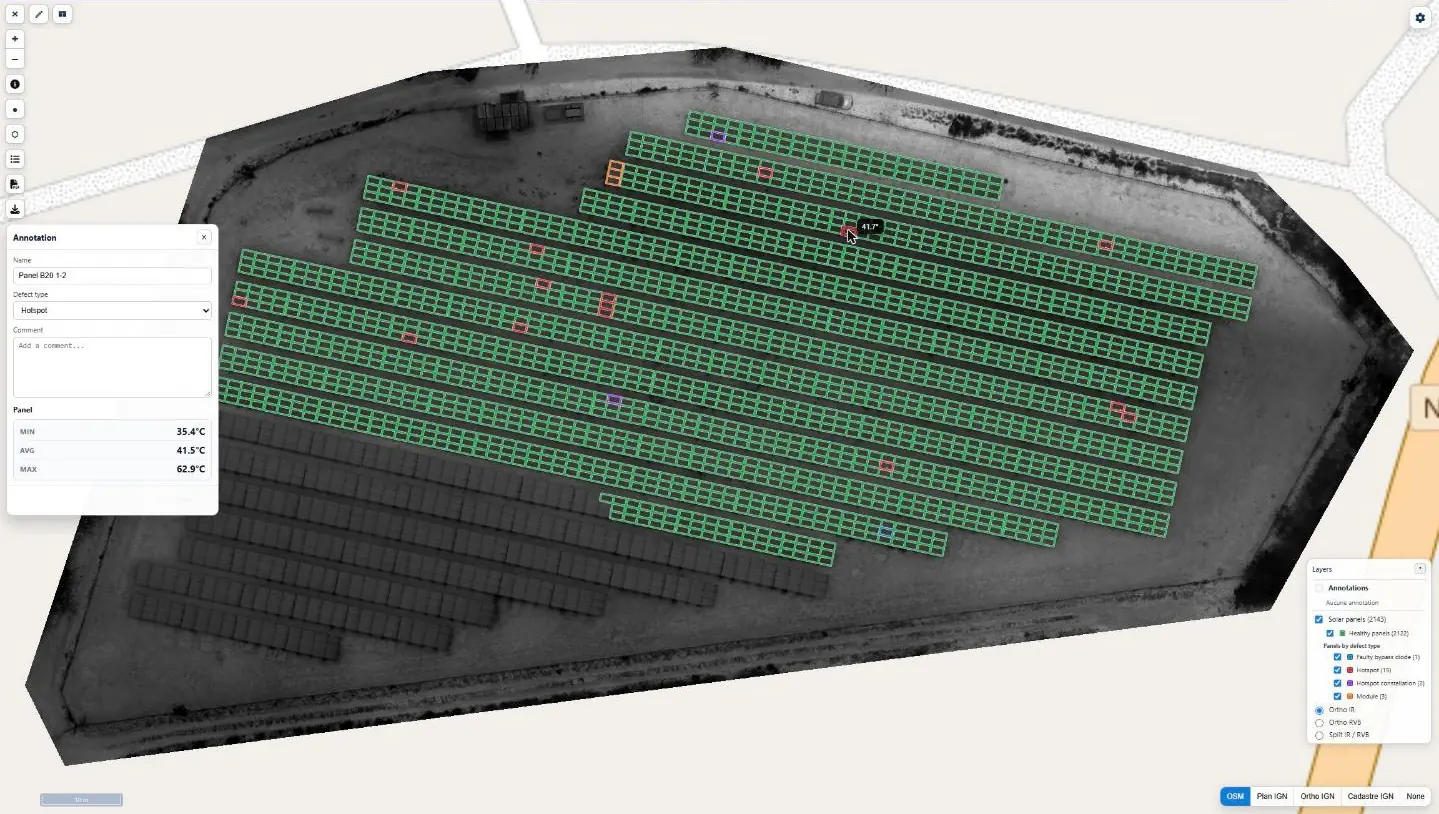
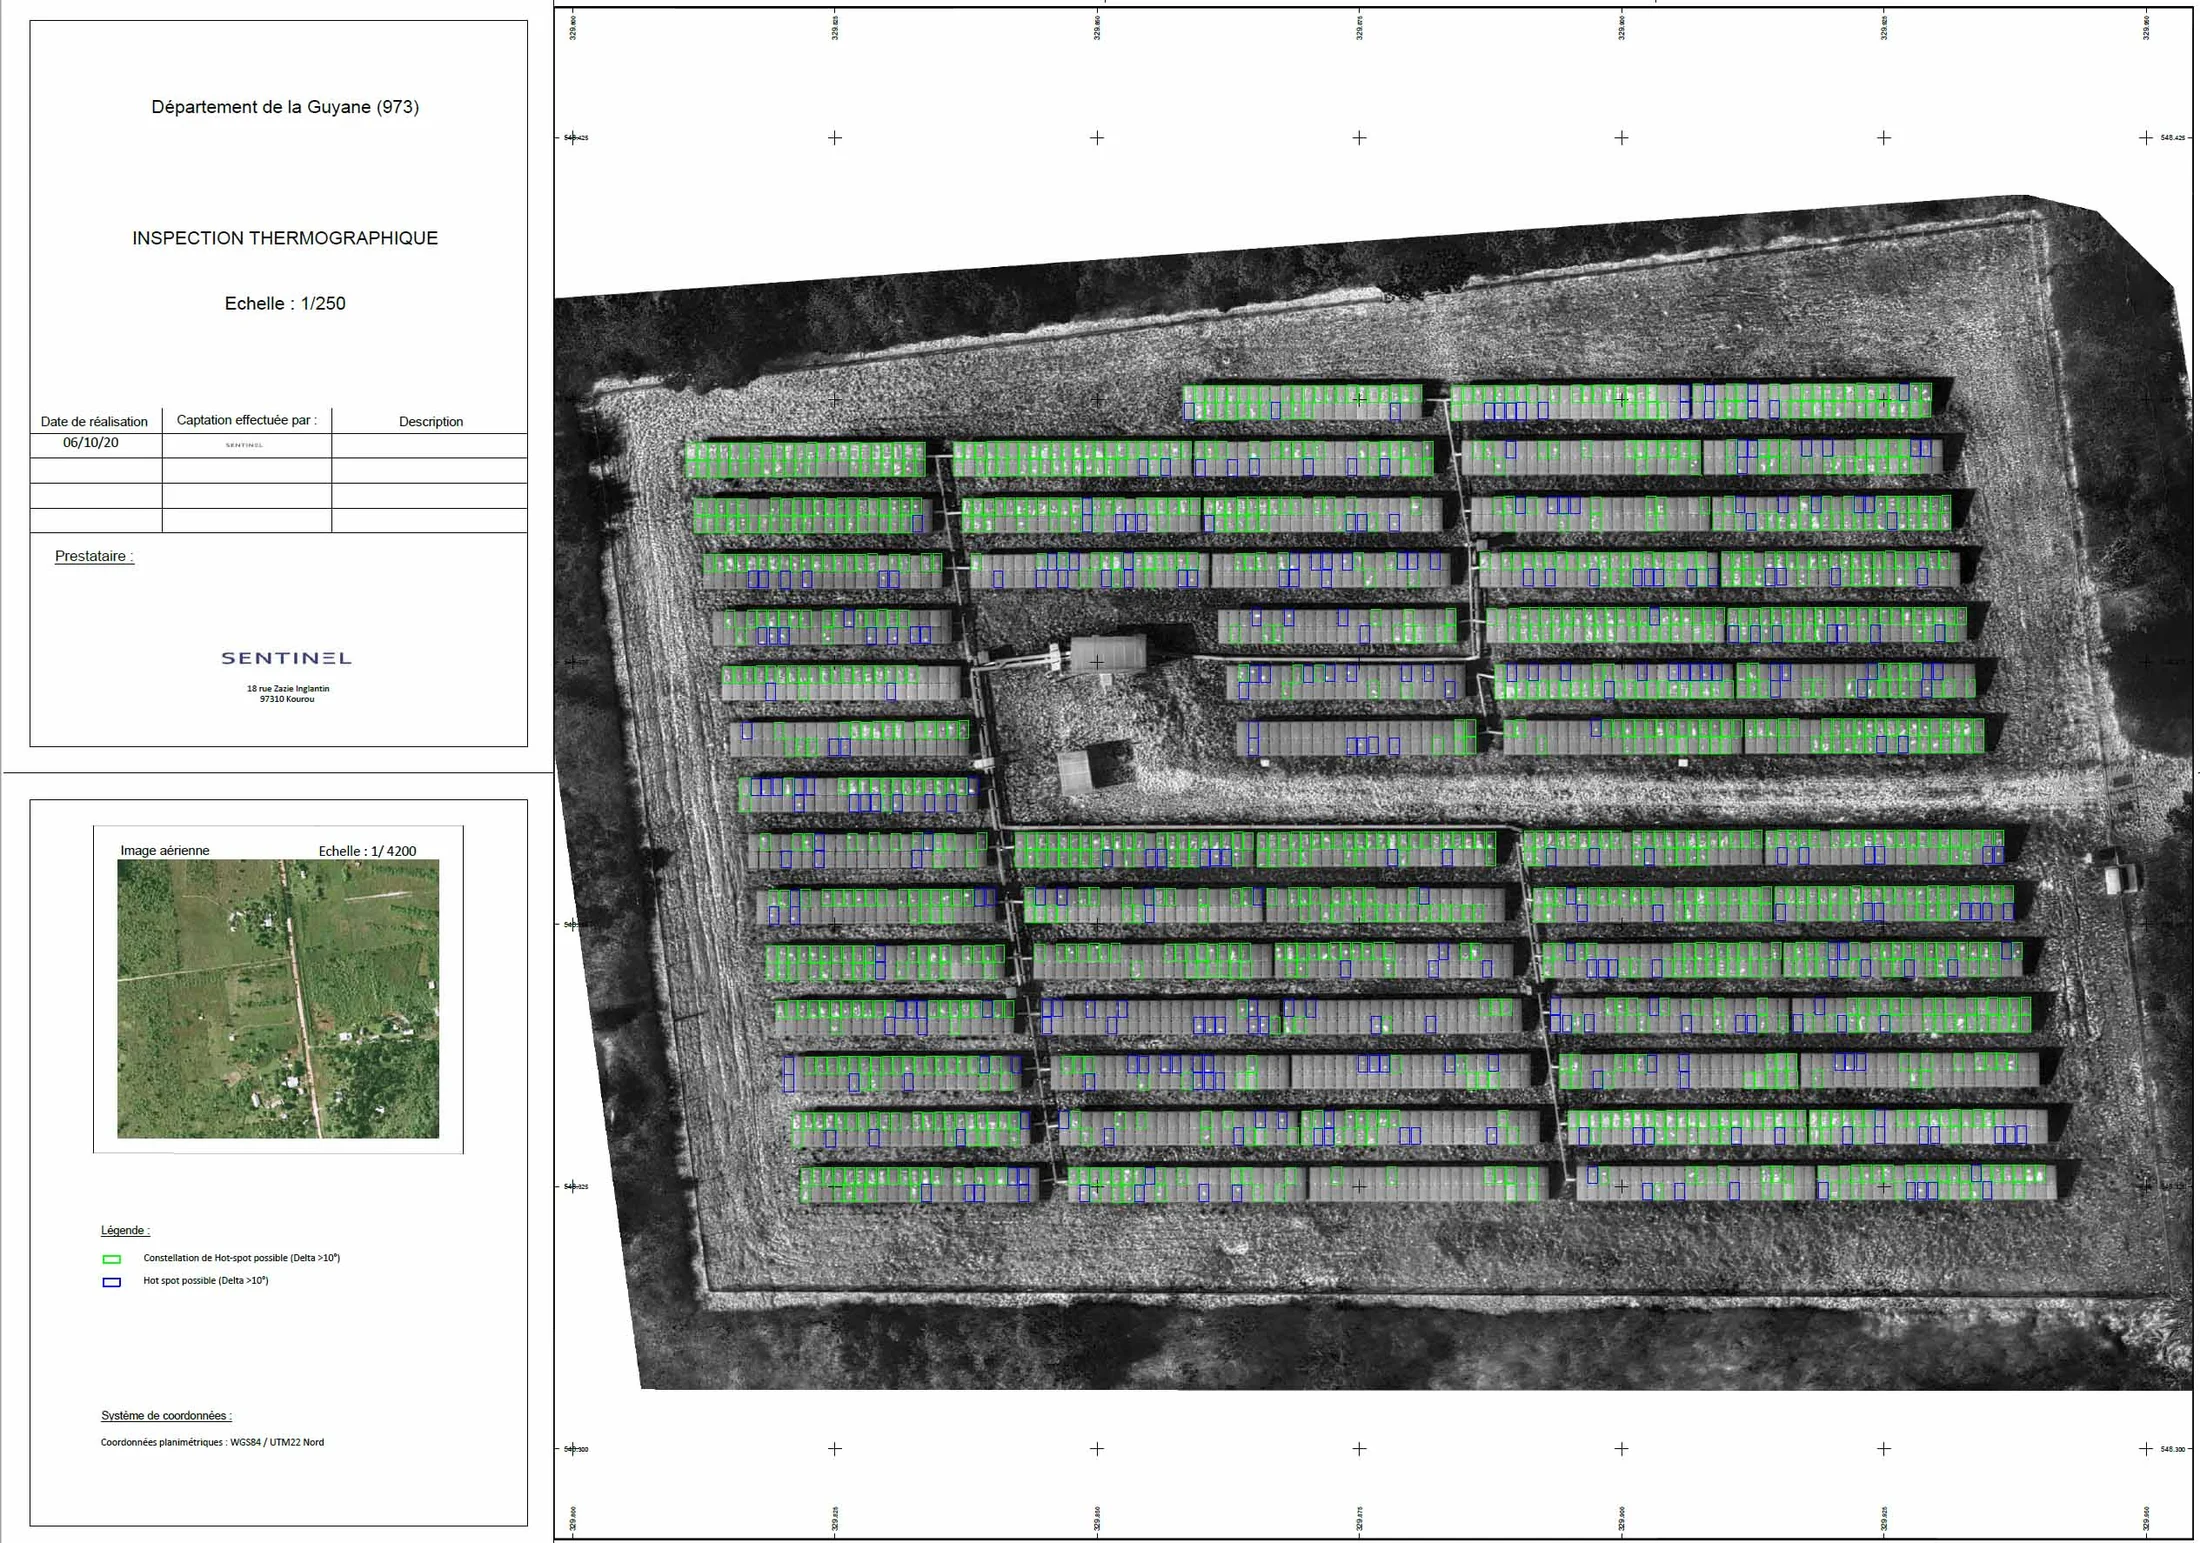
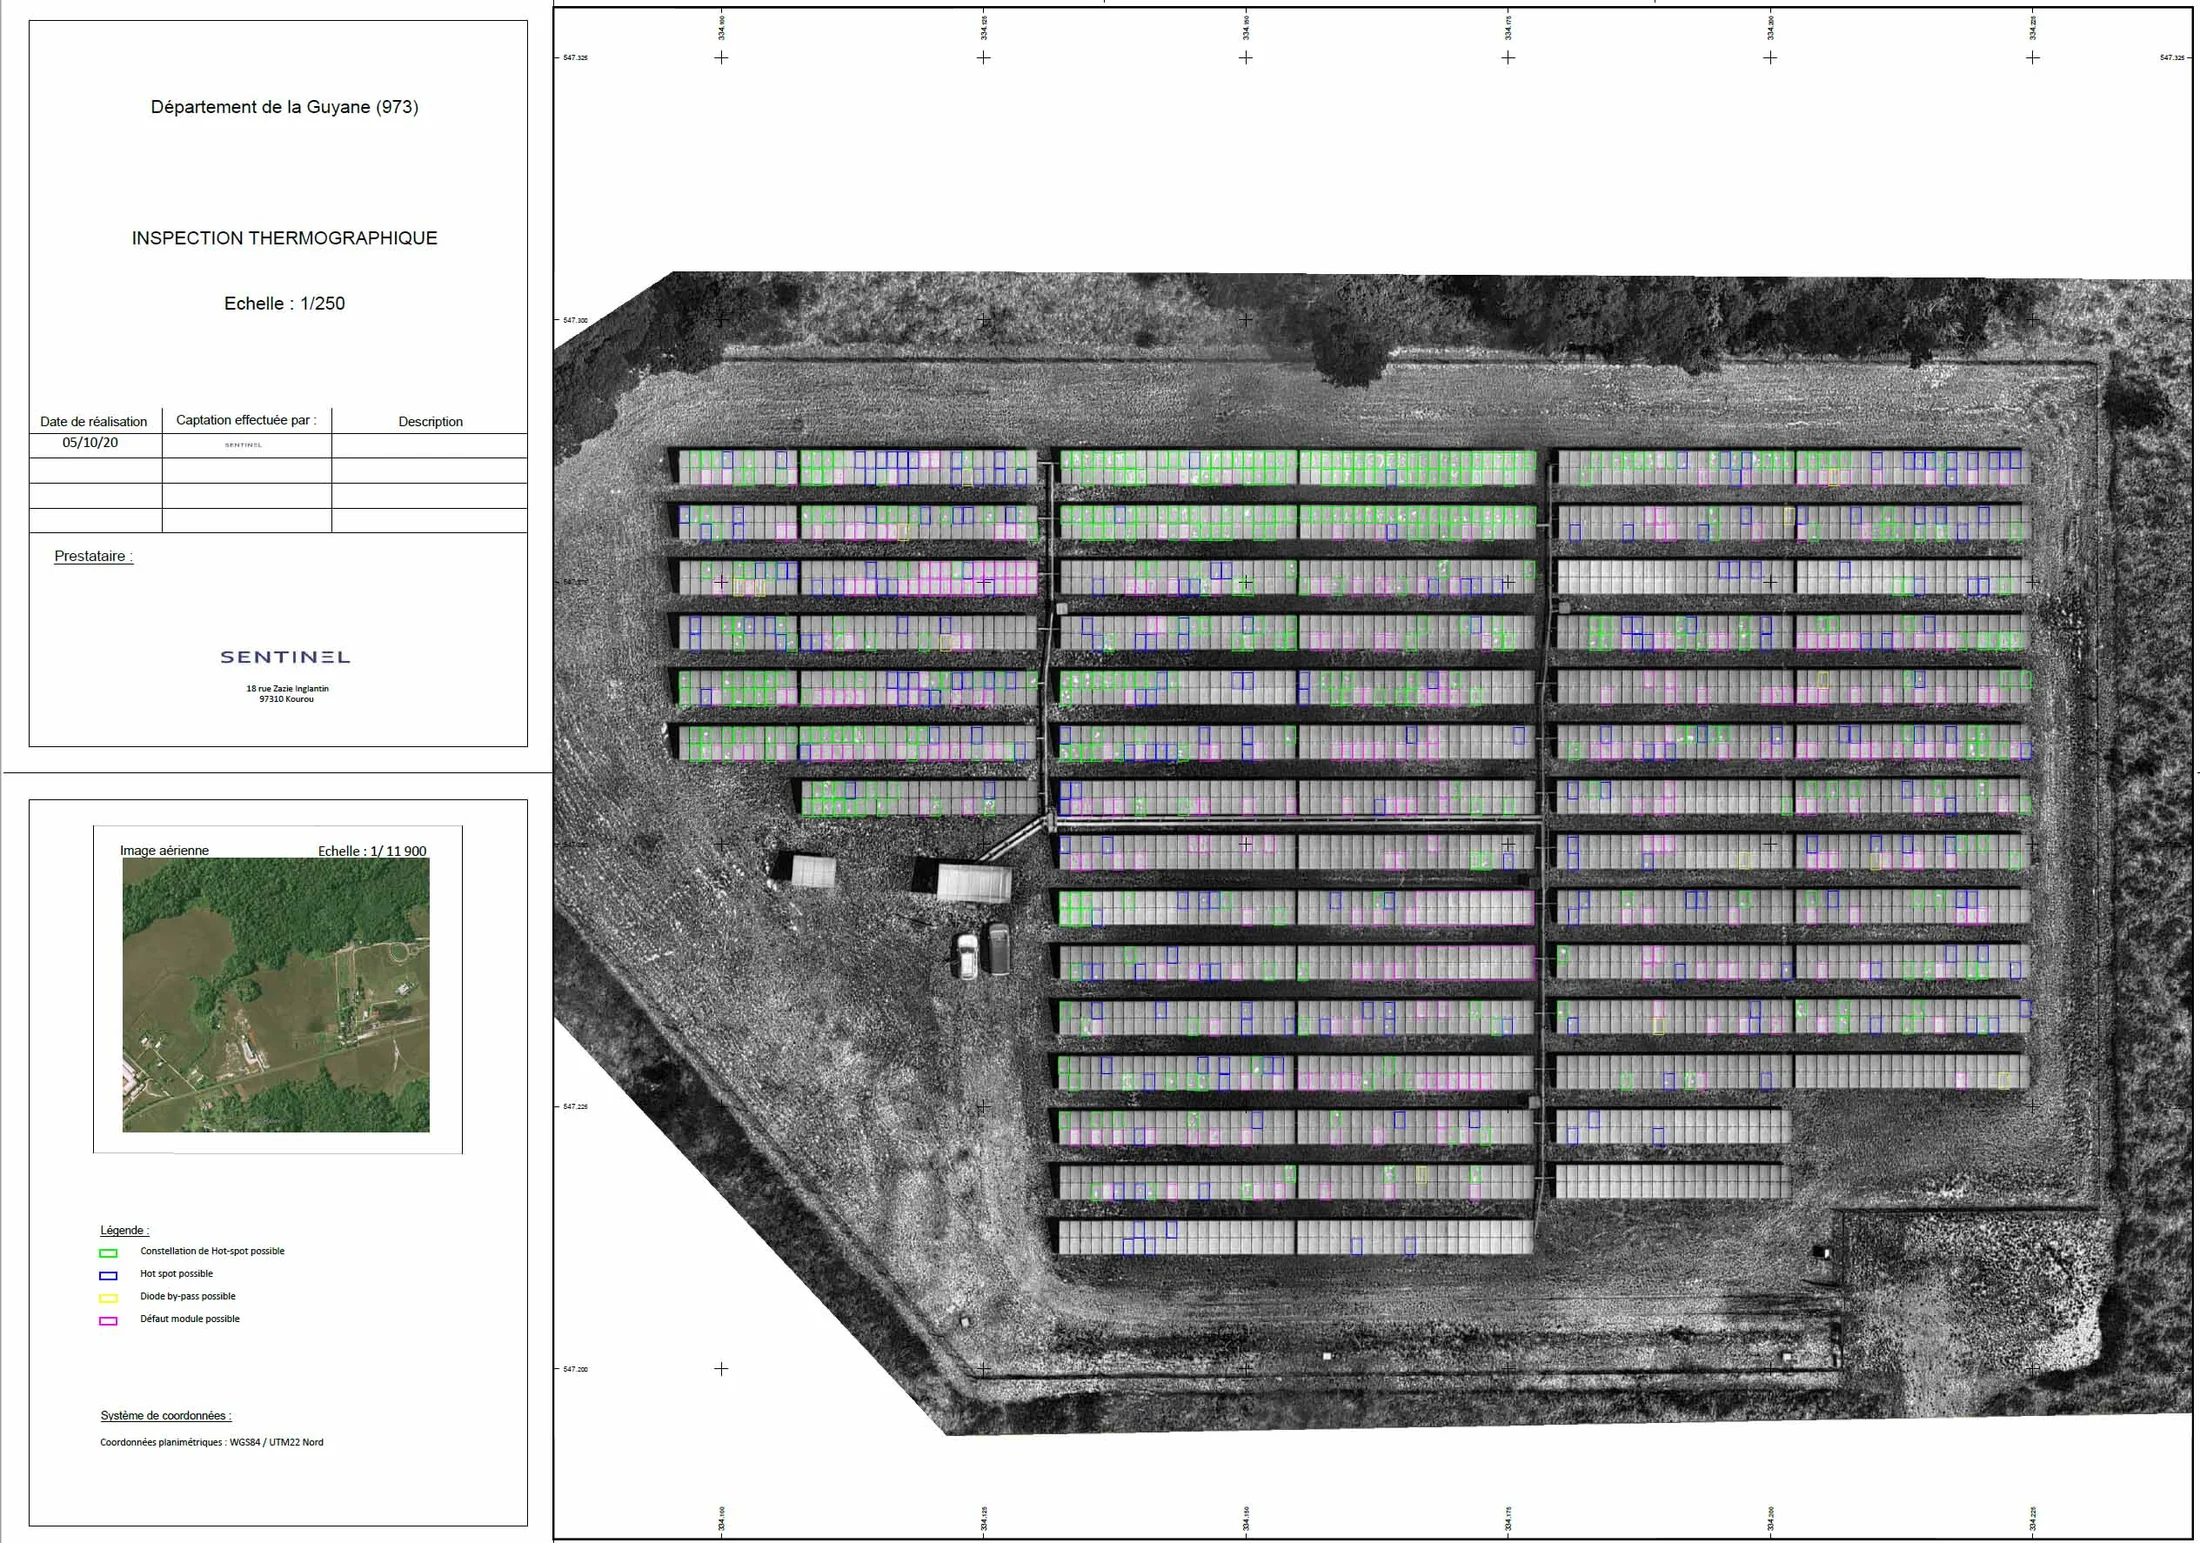
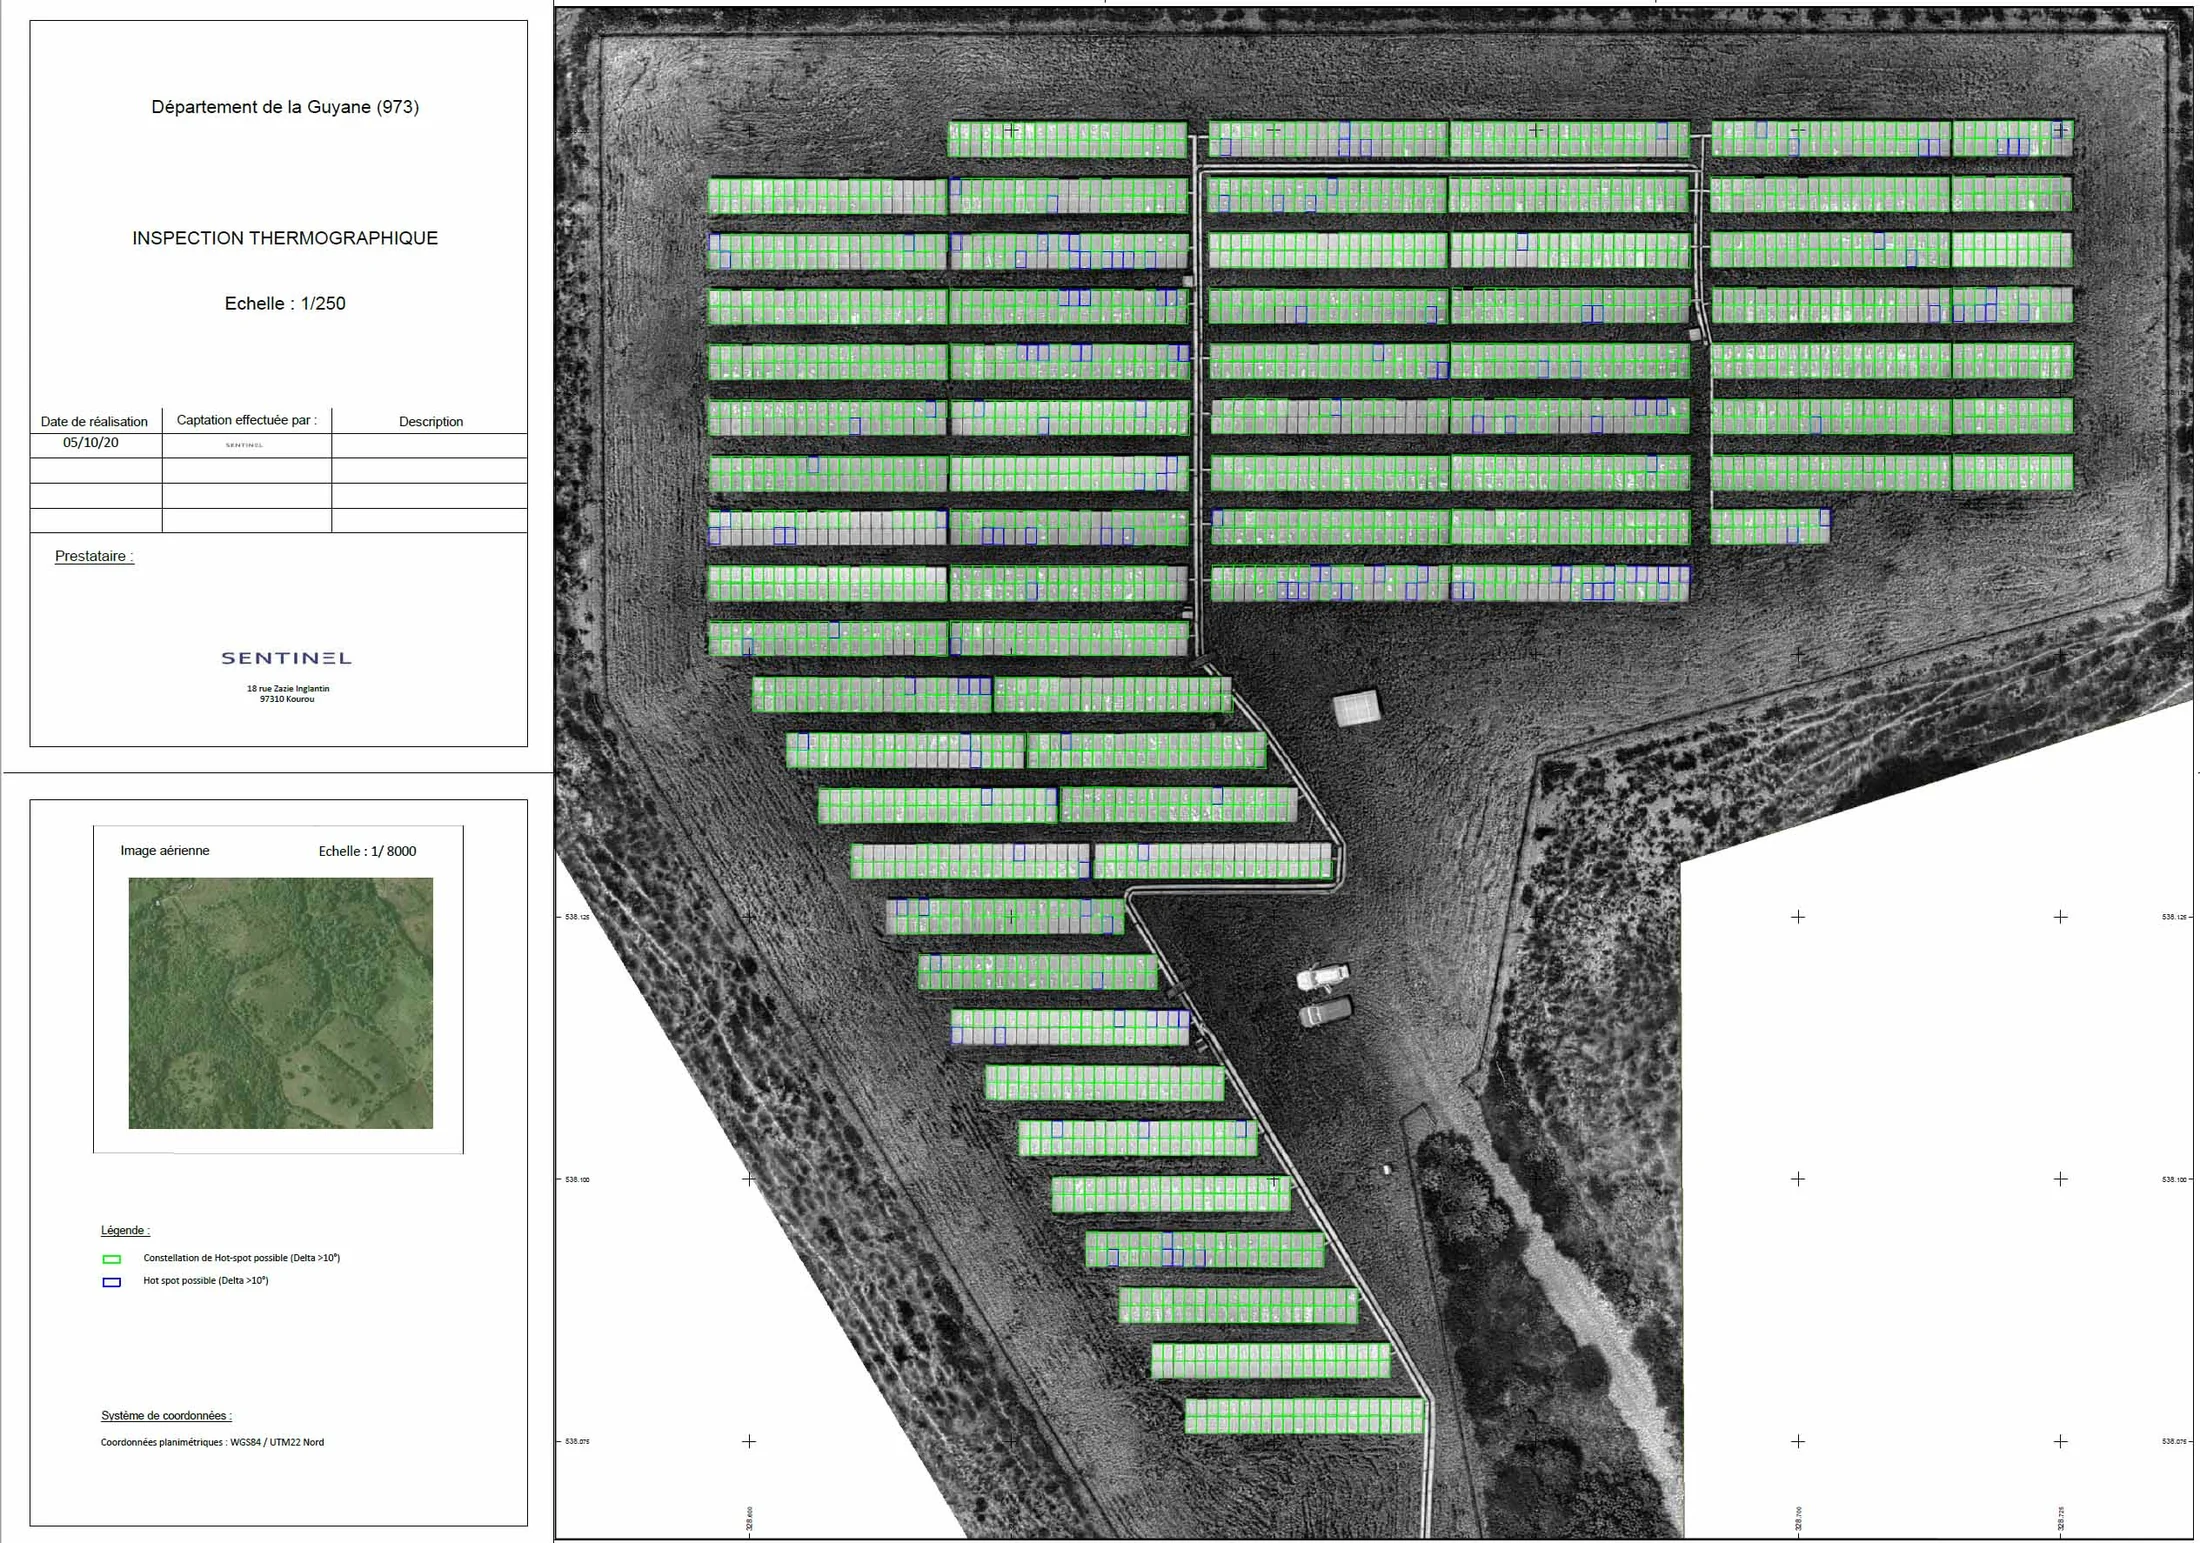
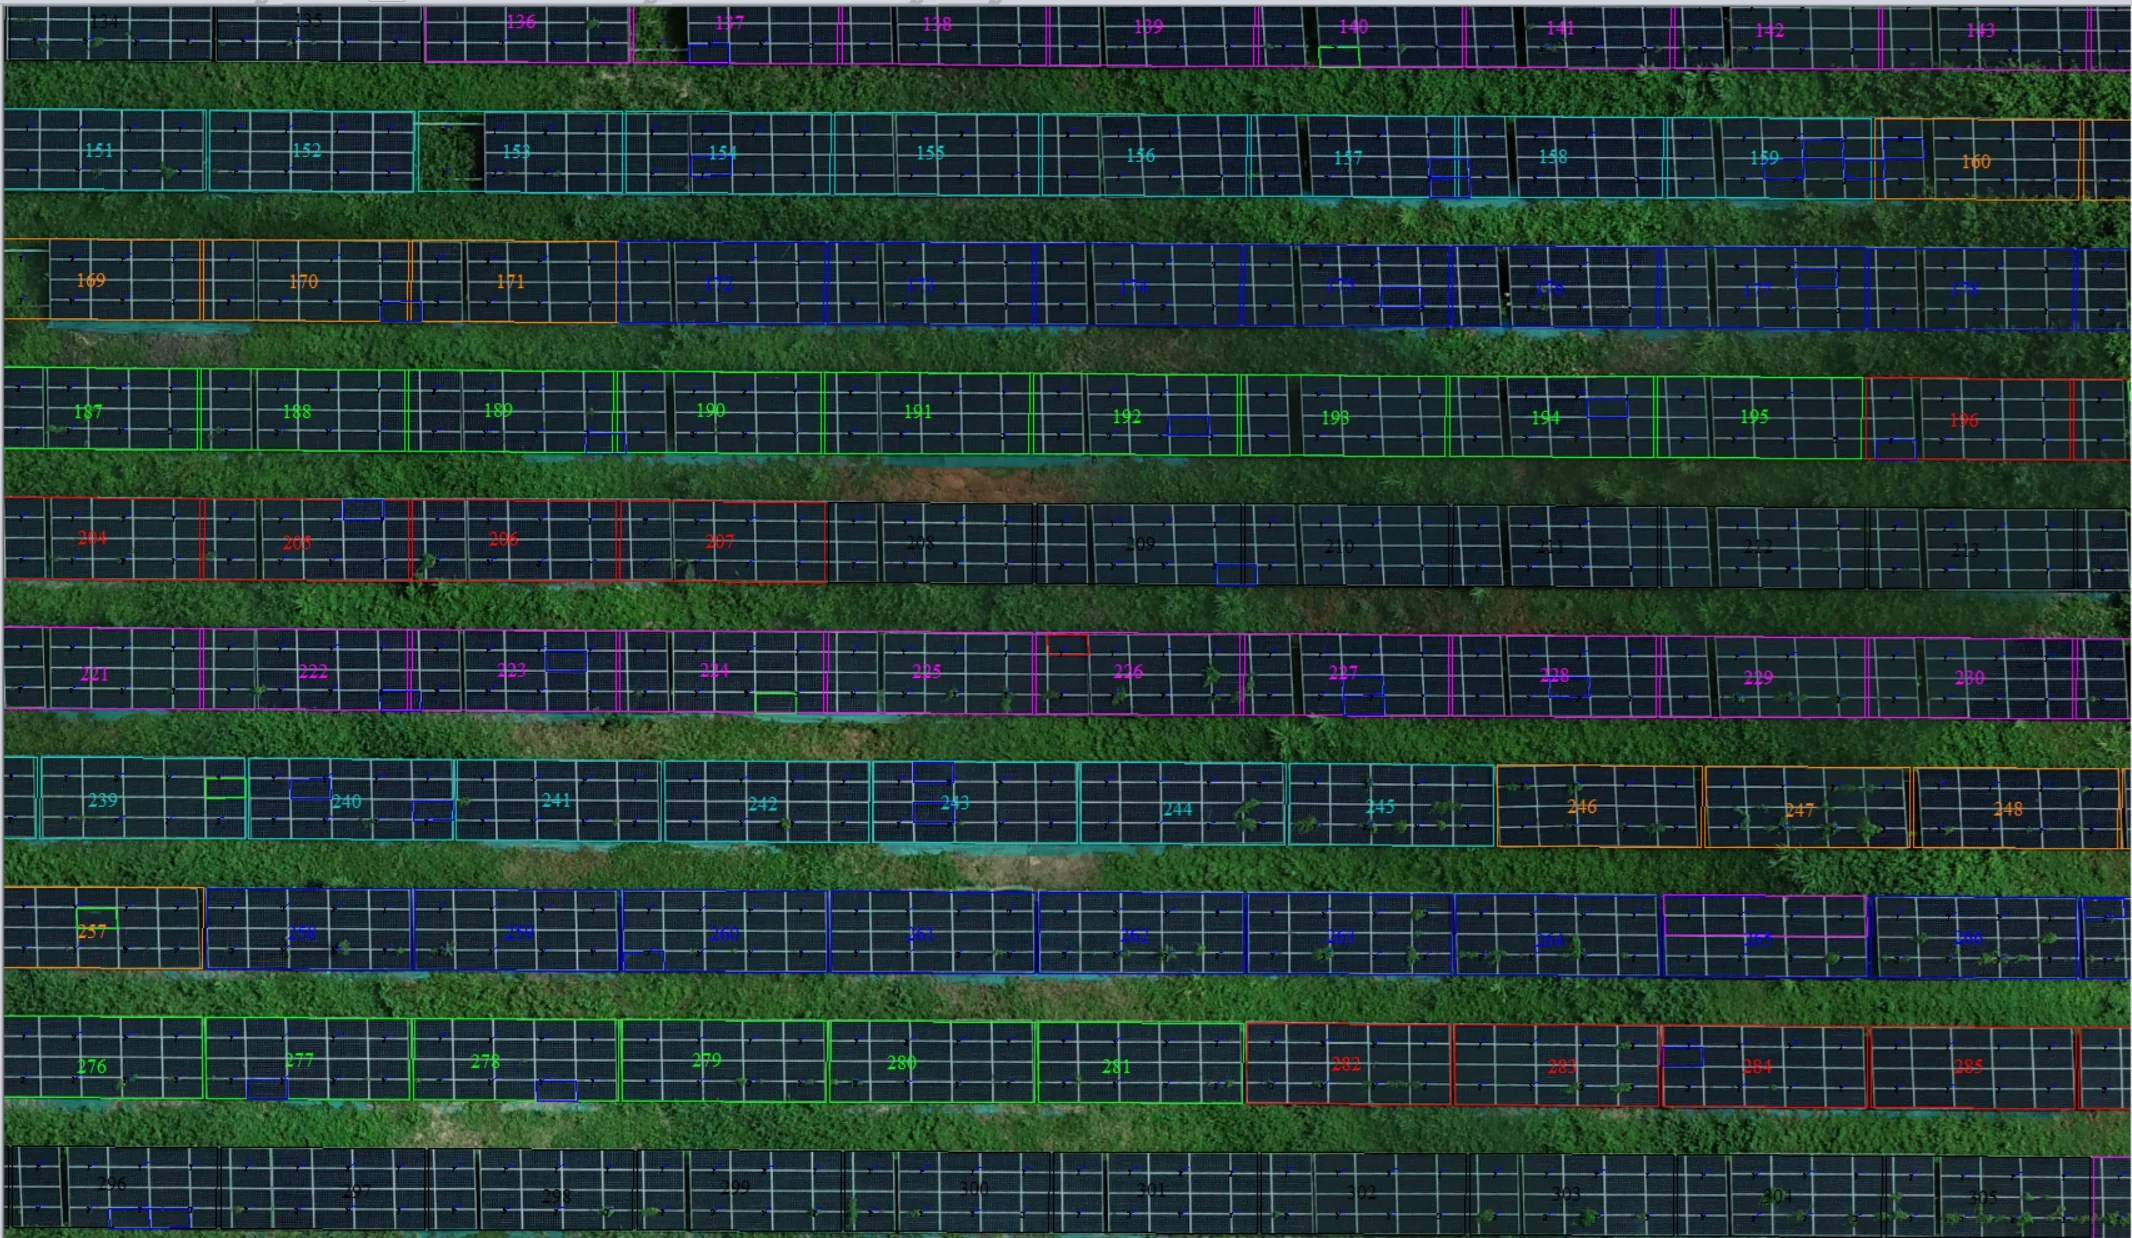
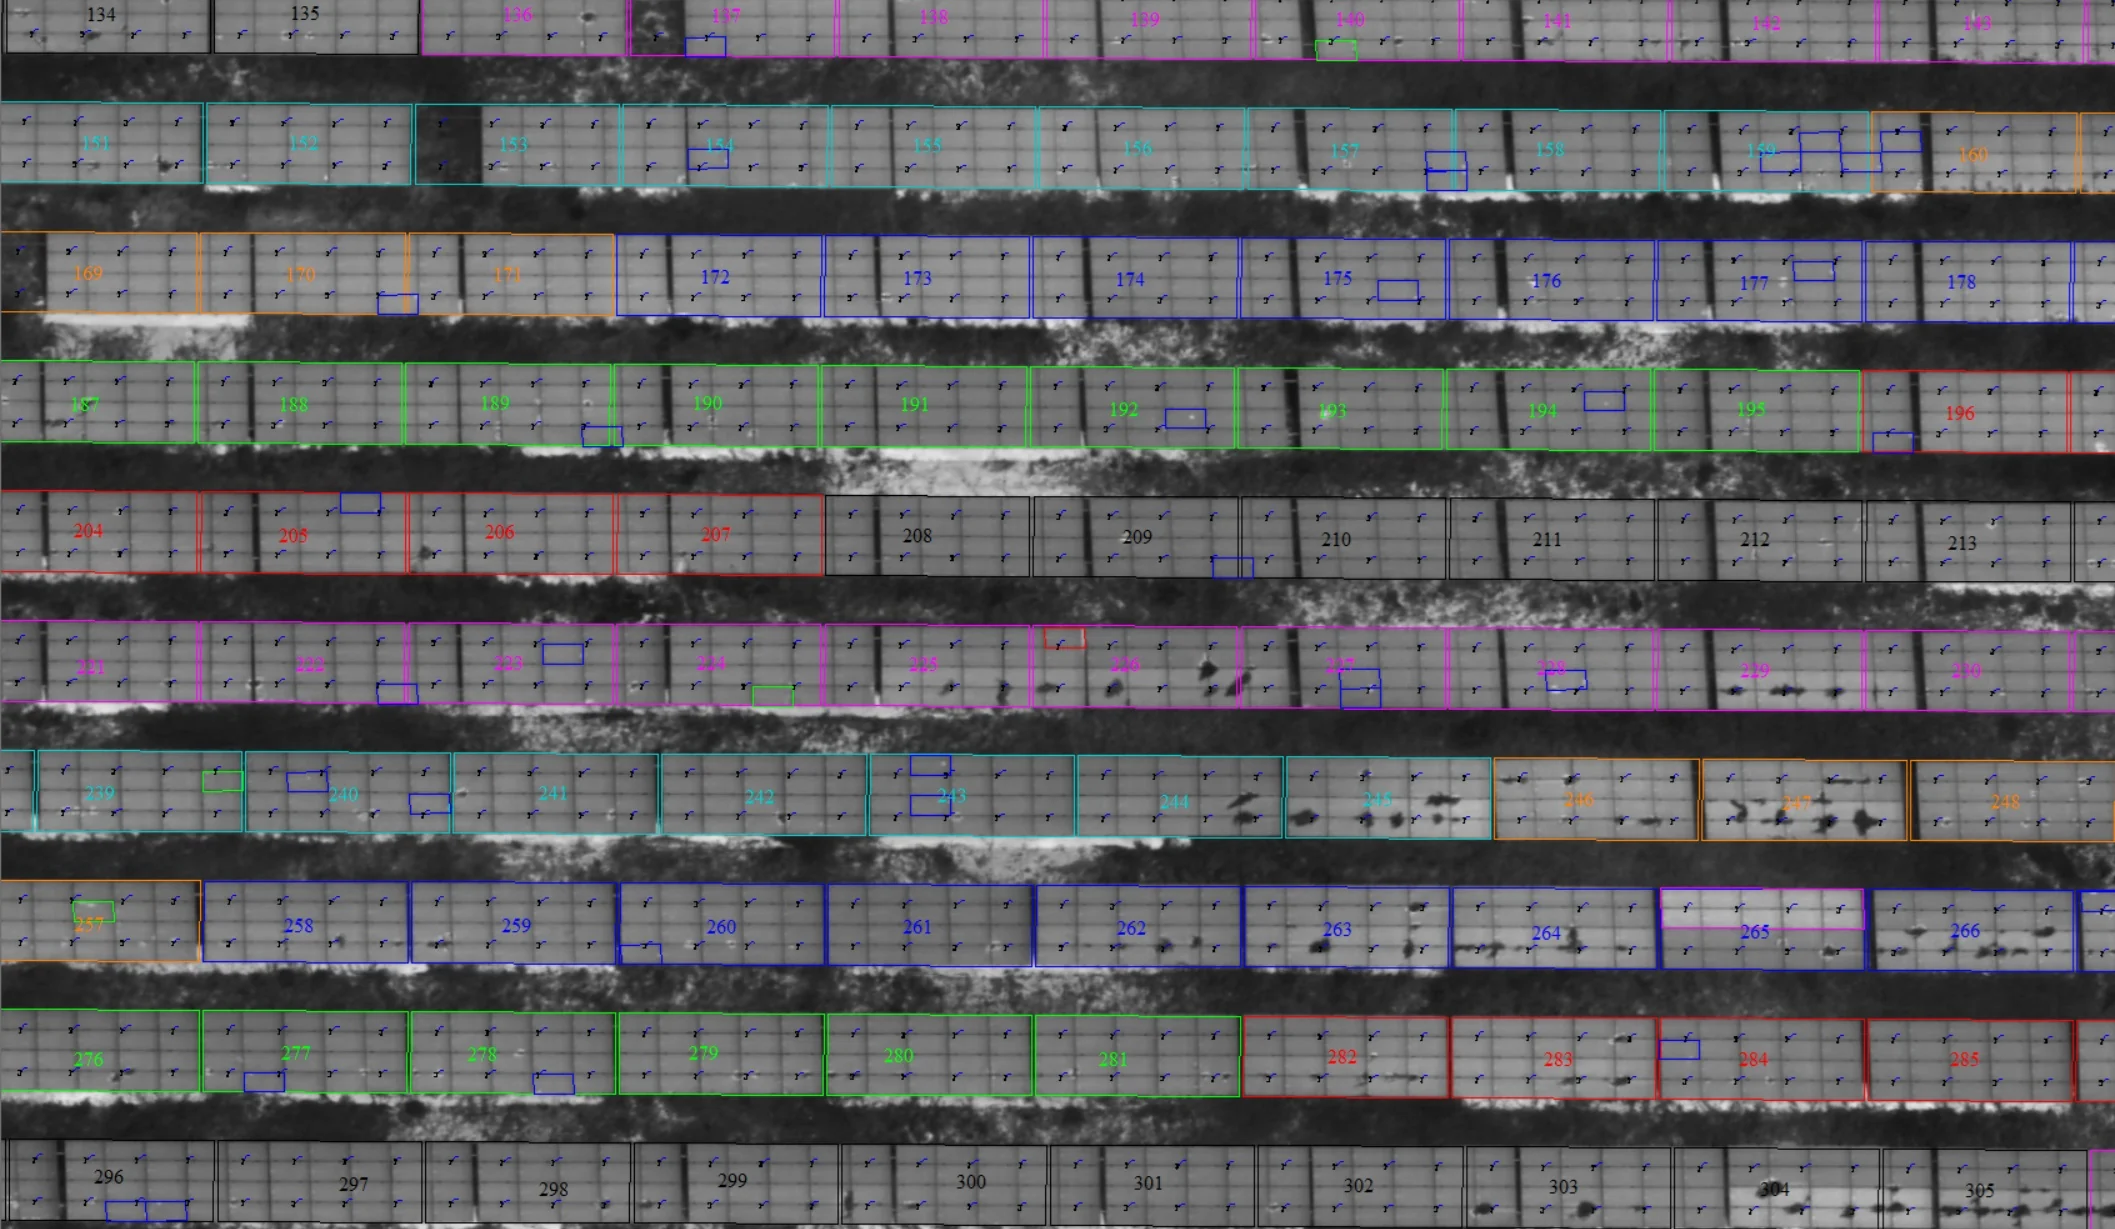
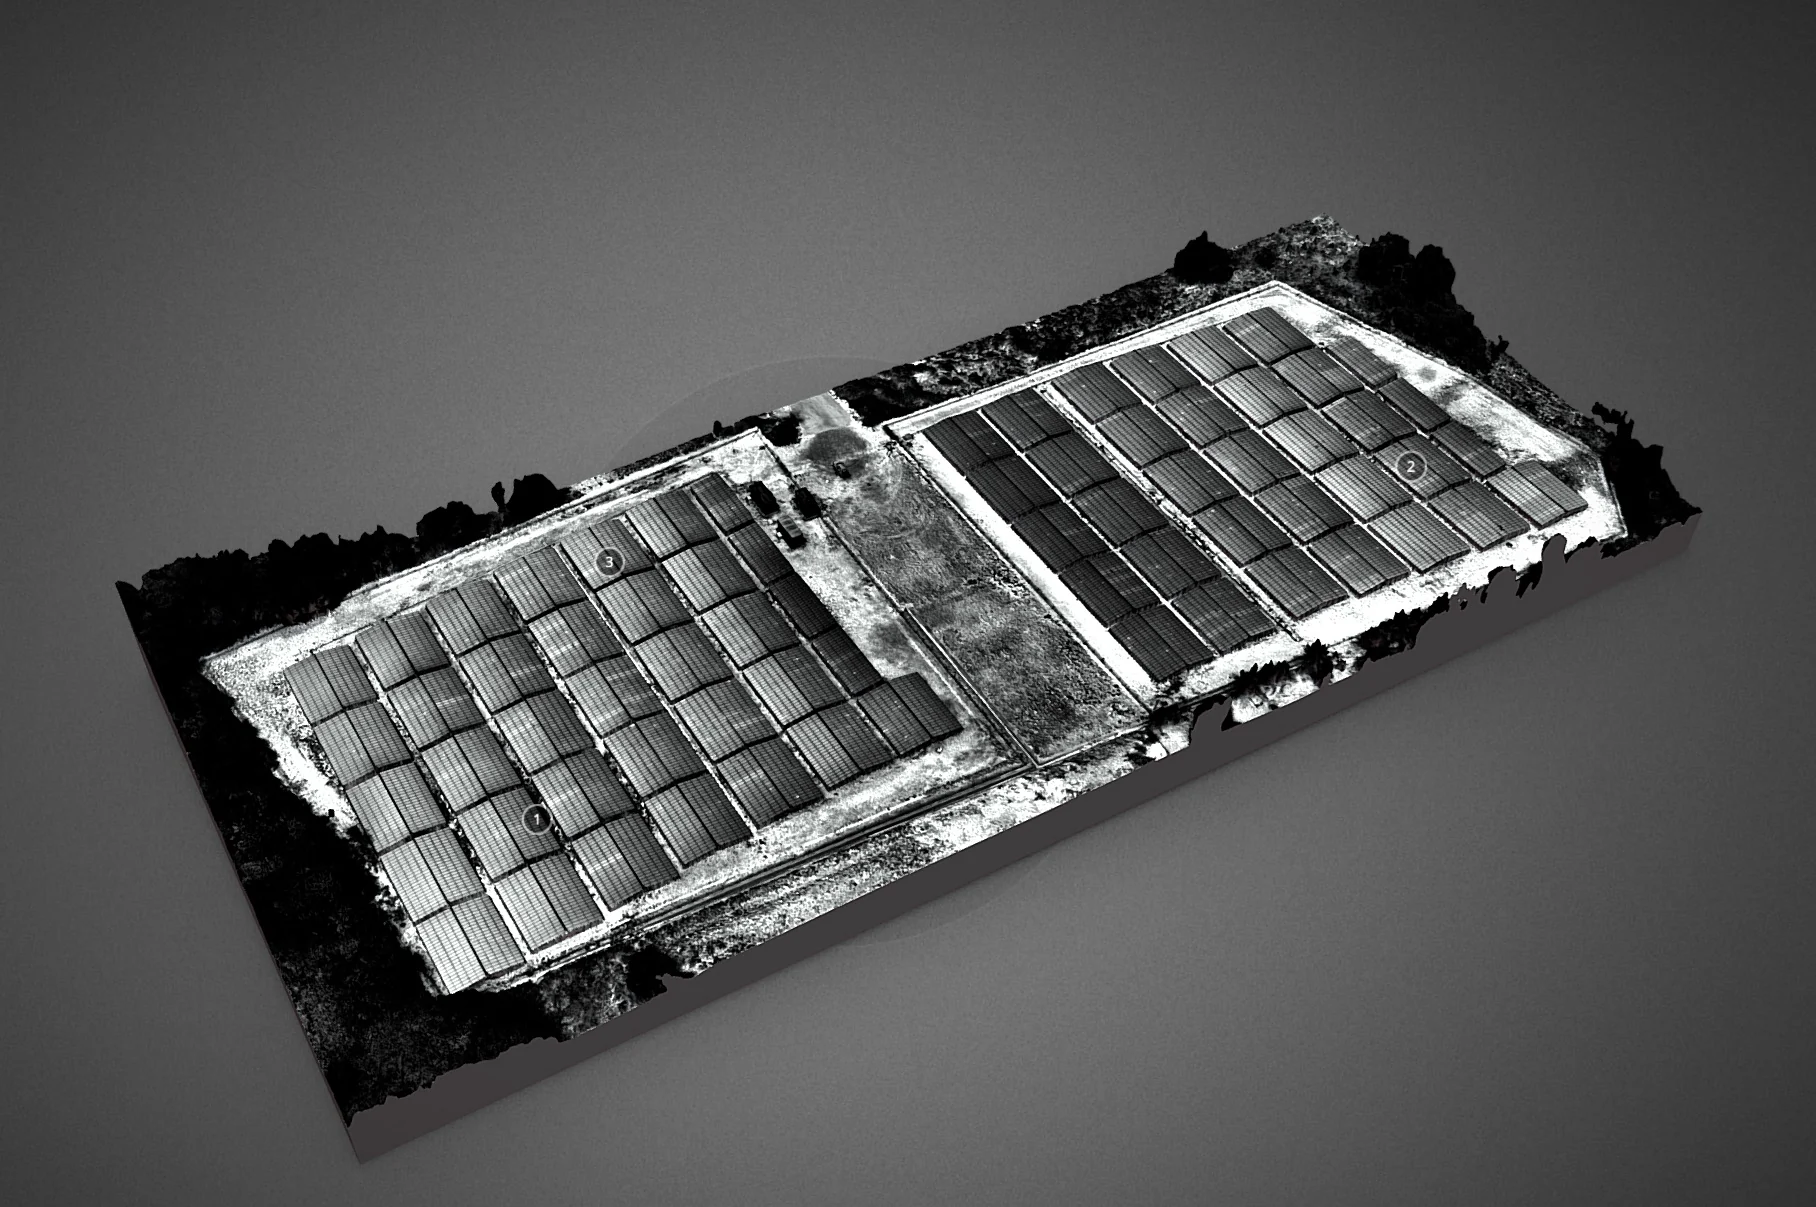
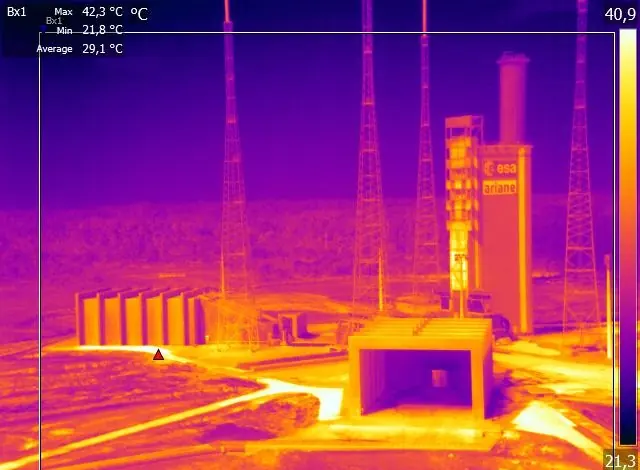
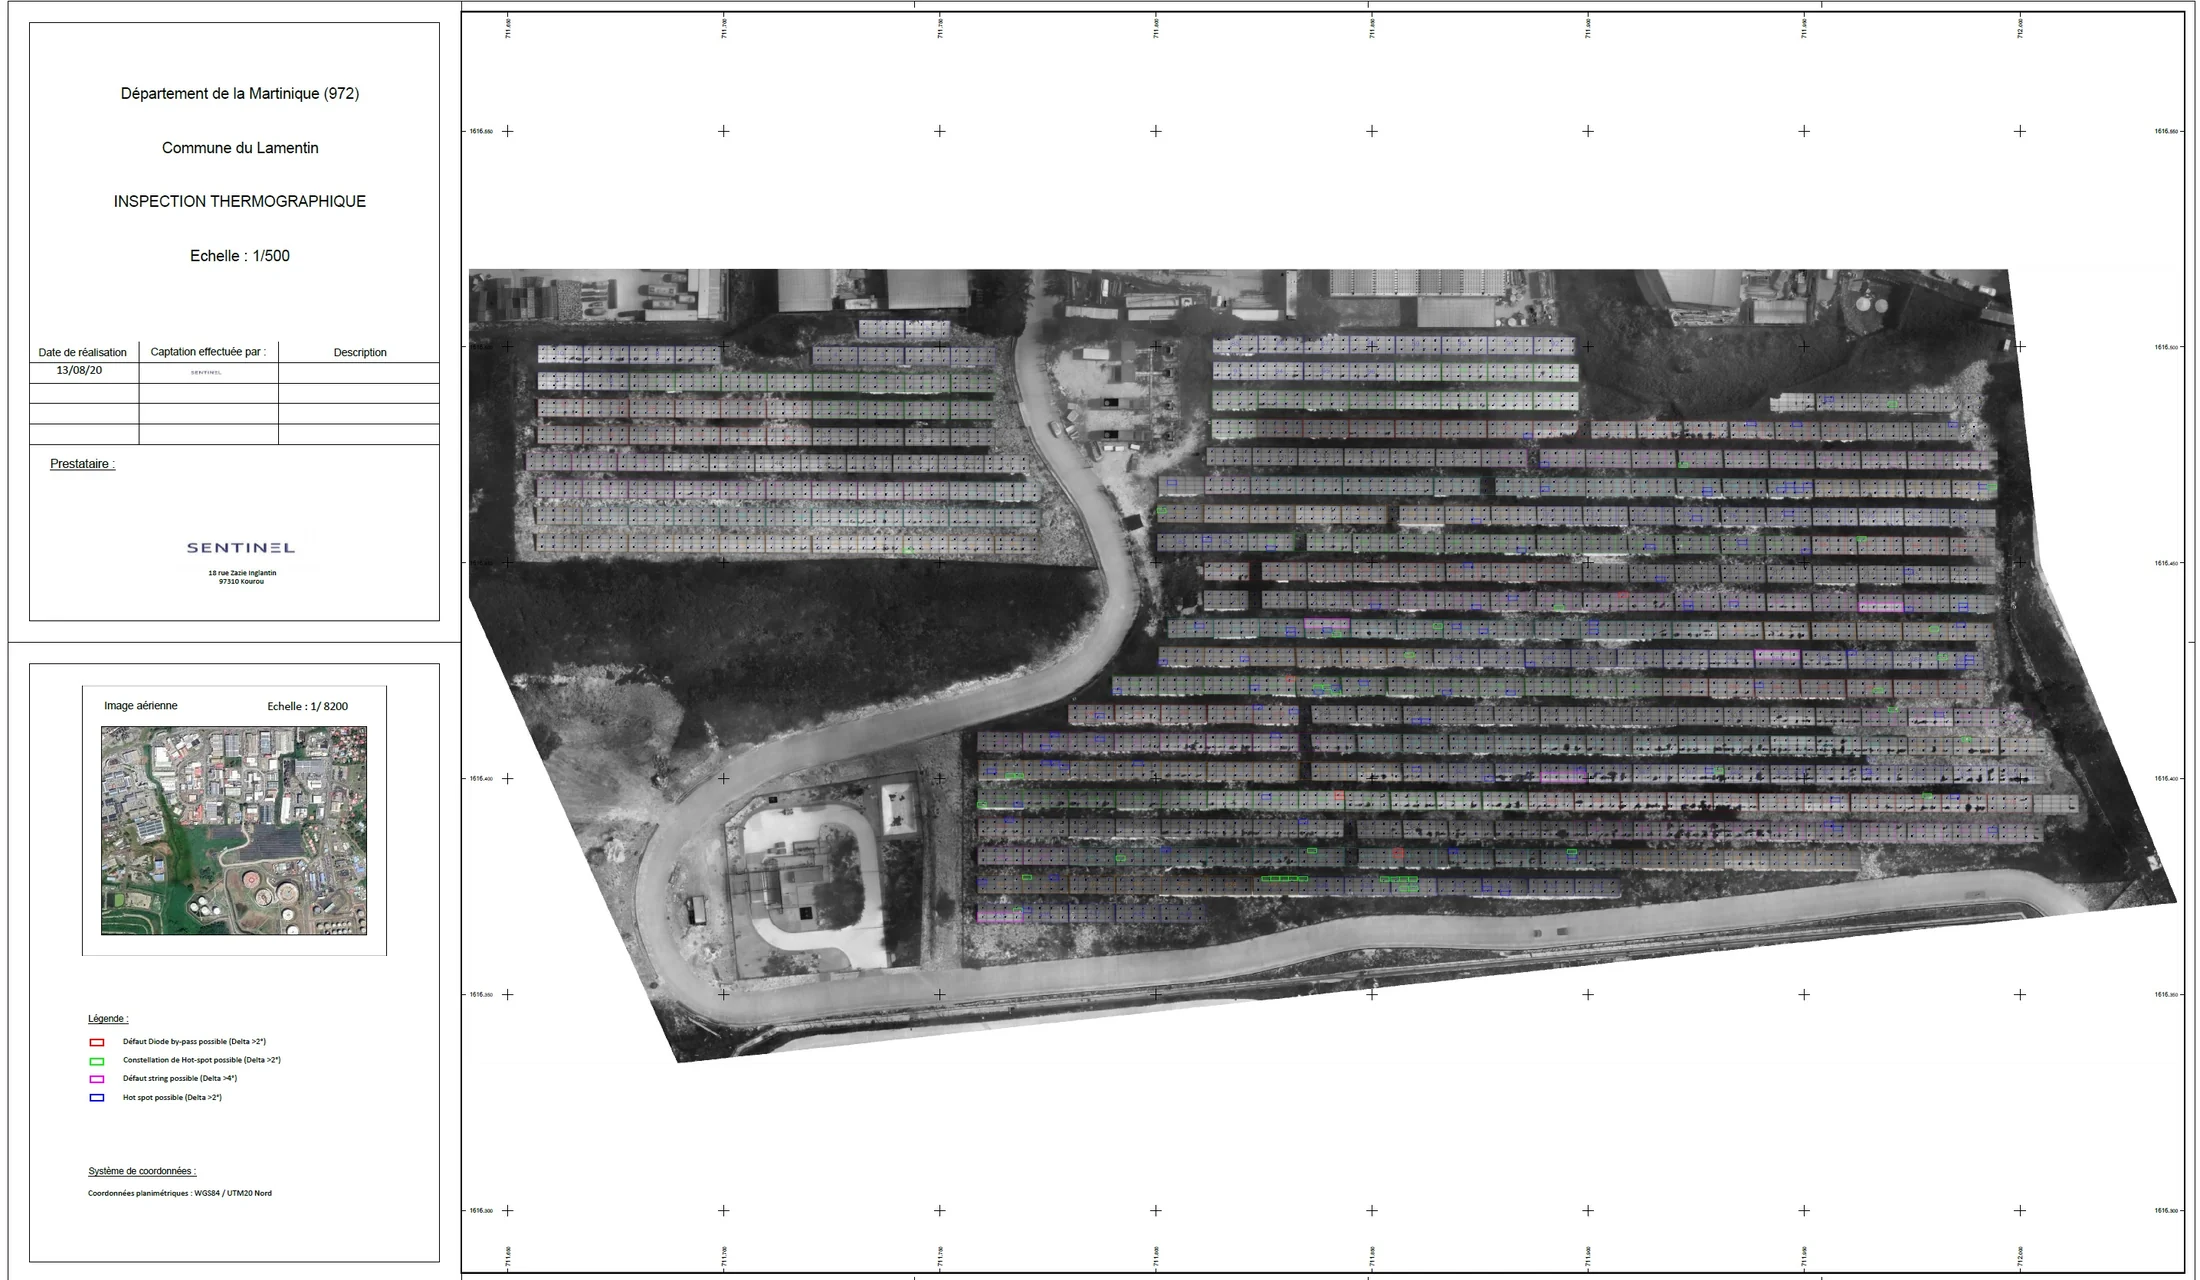
Sentinel Thermal Tool, our software, converts radiometric drone images into TIFF files that Agisoft Metashape can process into thermal orthophotos. About the software
Thermography projects
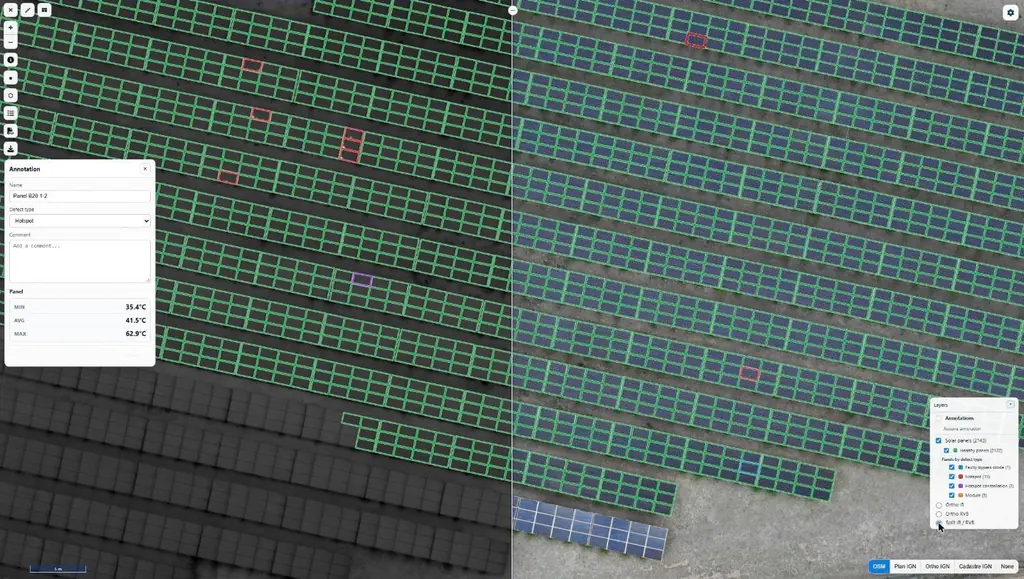
Eleven solar plants in 2026: 33,333 panels checked one by one
June to September 2026: eleven plants surveyed by thermography for Genergies in Martinique, Guadeloupe and French Guiana: 33,333 panels checked one by one.
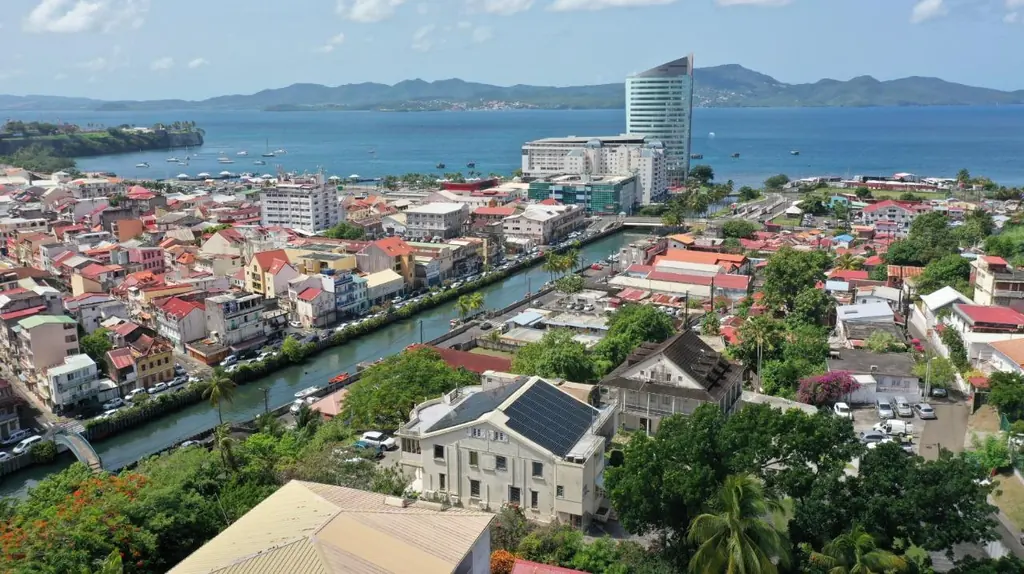
Nearly 1,500 sites surveyed since 2020 for a solar installer
Pre-installation roof surveys, 3D shading studies and thermal surveys of rooftop plants, across three territories since 2019.
Thermal inspection of the Ariane 5 launch pad
With Arianespace and RMT, thermal-camera check of the igniters of the launch pad’s hydrogen burn pond, from flight VA246 in December 2018.
Frequently asked questions
Under what conditions do you fly?
When irradiance exceeds 600 W/m², the threshold set by the IEC TS 62446-3 standard, and when the plant is producing: without current, defects do not heat up. On our eleven plants in 2026, recorded irradiance ranged from 720 W/m² in Matoury in September to 1,267 W/m² in Guadeloupe in August.
What infrared resolution?
Usually 3 cm per pixel in infrared, from 2.8 to 4 cm depending on the height the site imposes (4 cm beneath the medium-voltage lines in Bellefontaine), and 1 to 1.5 cm in visible light: enough to assign each hot spot to a specific panel and to tell a failing cell from mere shading.
Which defects do you detect?
Single hot spots, clusters of hot spots, failing modules, bypass diodes, strings out of service and shading caused by vegetation. On eight plants in Guadeloupe, nearly three anomalies in ten came from vegetation.
How does the maintenance team find the panels?
Every flagged panel has its own record: infrared and visible images, minimum, mean and maximum temperatures, GPS position and directions. The same information is on the plan and in Sentinel Cloud.
Do you also work on rooftops?
Yes: warehouses, shops, port buildings and head offices in Martinique, Guadeloupe and French Guiana, with the same deliverables as for ground-mounted plants.
Tell us about your project
Location, area or structure, expected deliverables and timing: with these details we can propose a method and a quote.
97310 Kourou
French Guiana
Route des Trois-Îlets
97229 Les Trois-Îlets
Martinique
Centro, 20030-041 Rio de Janeiro – RJ
Brazil