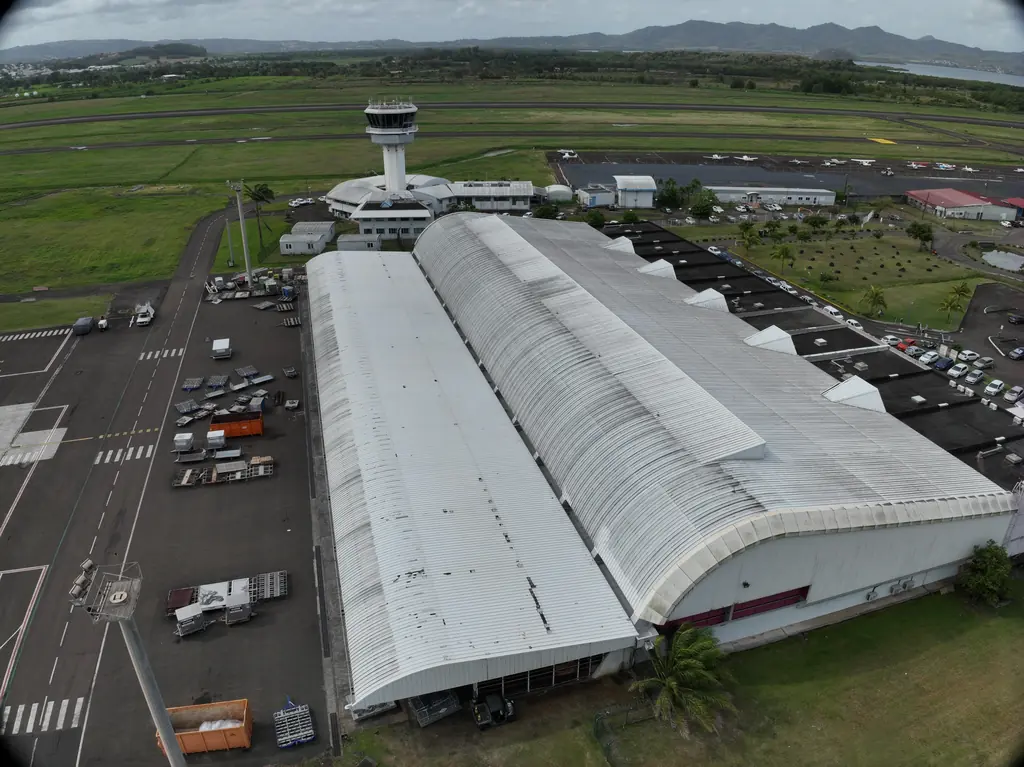
Bellefontaine: 8,996 panels inspected in infrared beneath medium-voltage lines
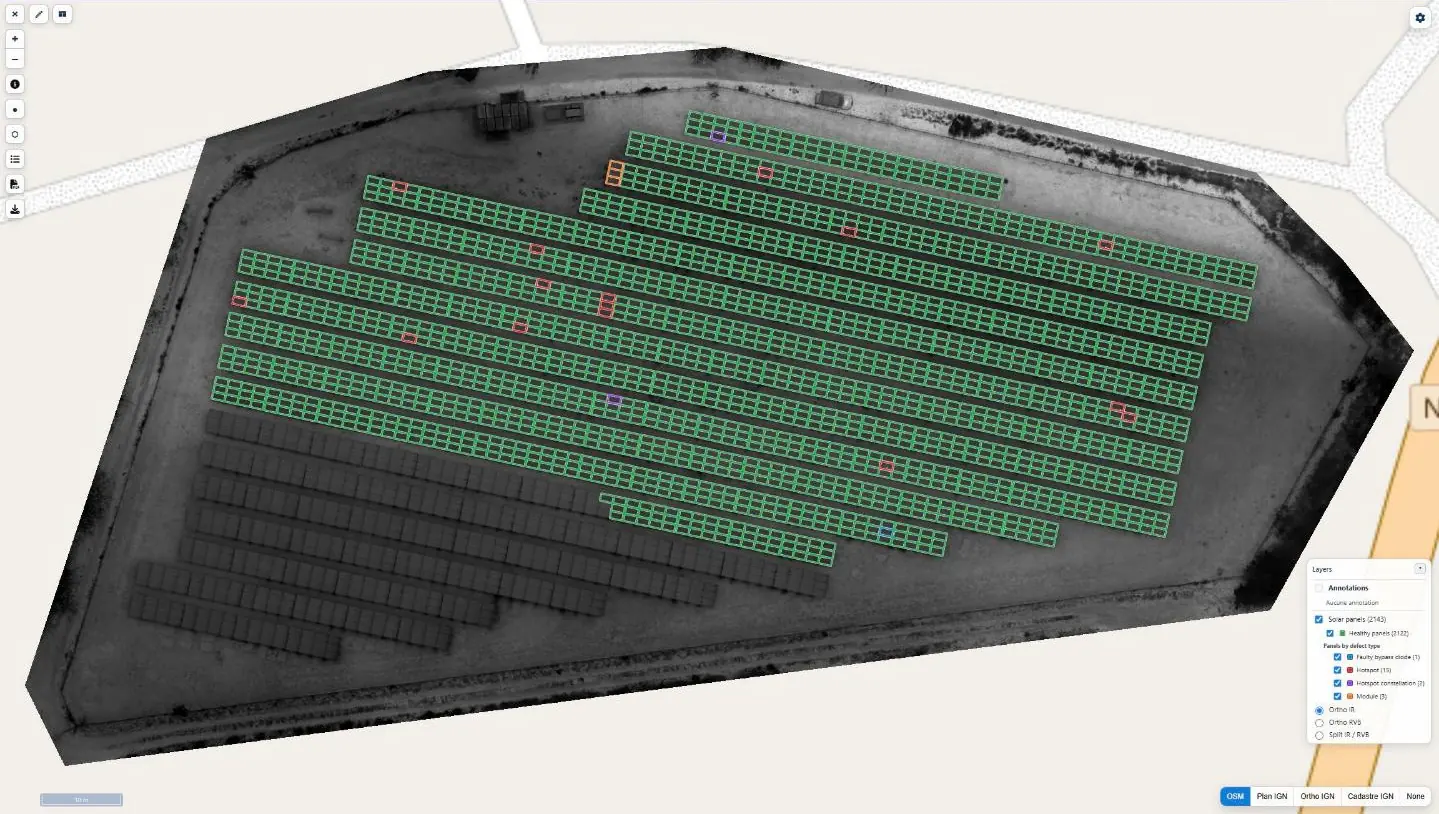
In Bellefontaine, on the Caribbean coast of Martinique, a 4,947.8 kWp ground-mounted plant lines up 8,996 modules of 550 Wp on 346 tables, i.e. 2.3 hectares of panels on a 3.9-hectare site. In July 2026 its operator, Genergies, asked us for the same panel-by-panel diagnosis we had carried out a month earlier in Le Carbet. A few days before the job, a further piece of information arrived: medium-voltage lines run above the plant.
A flight plan based on a LiDAR survey
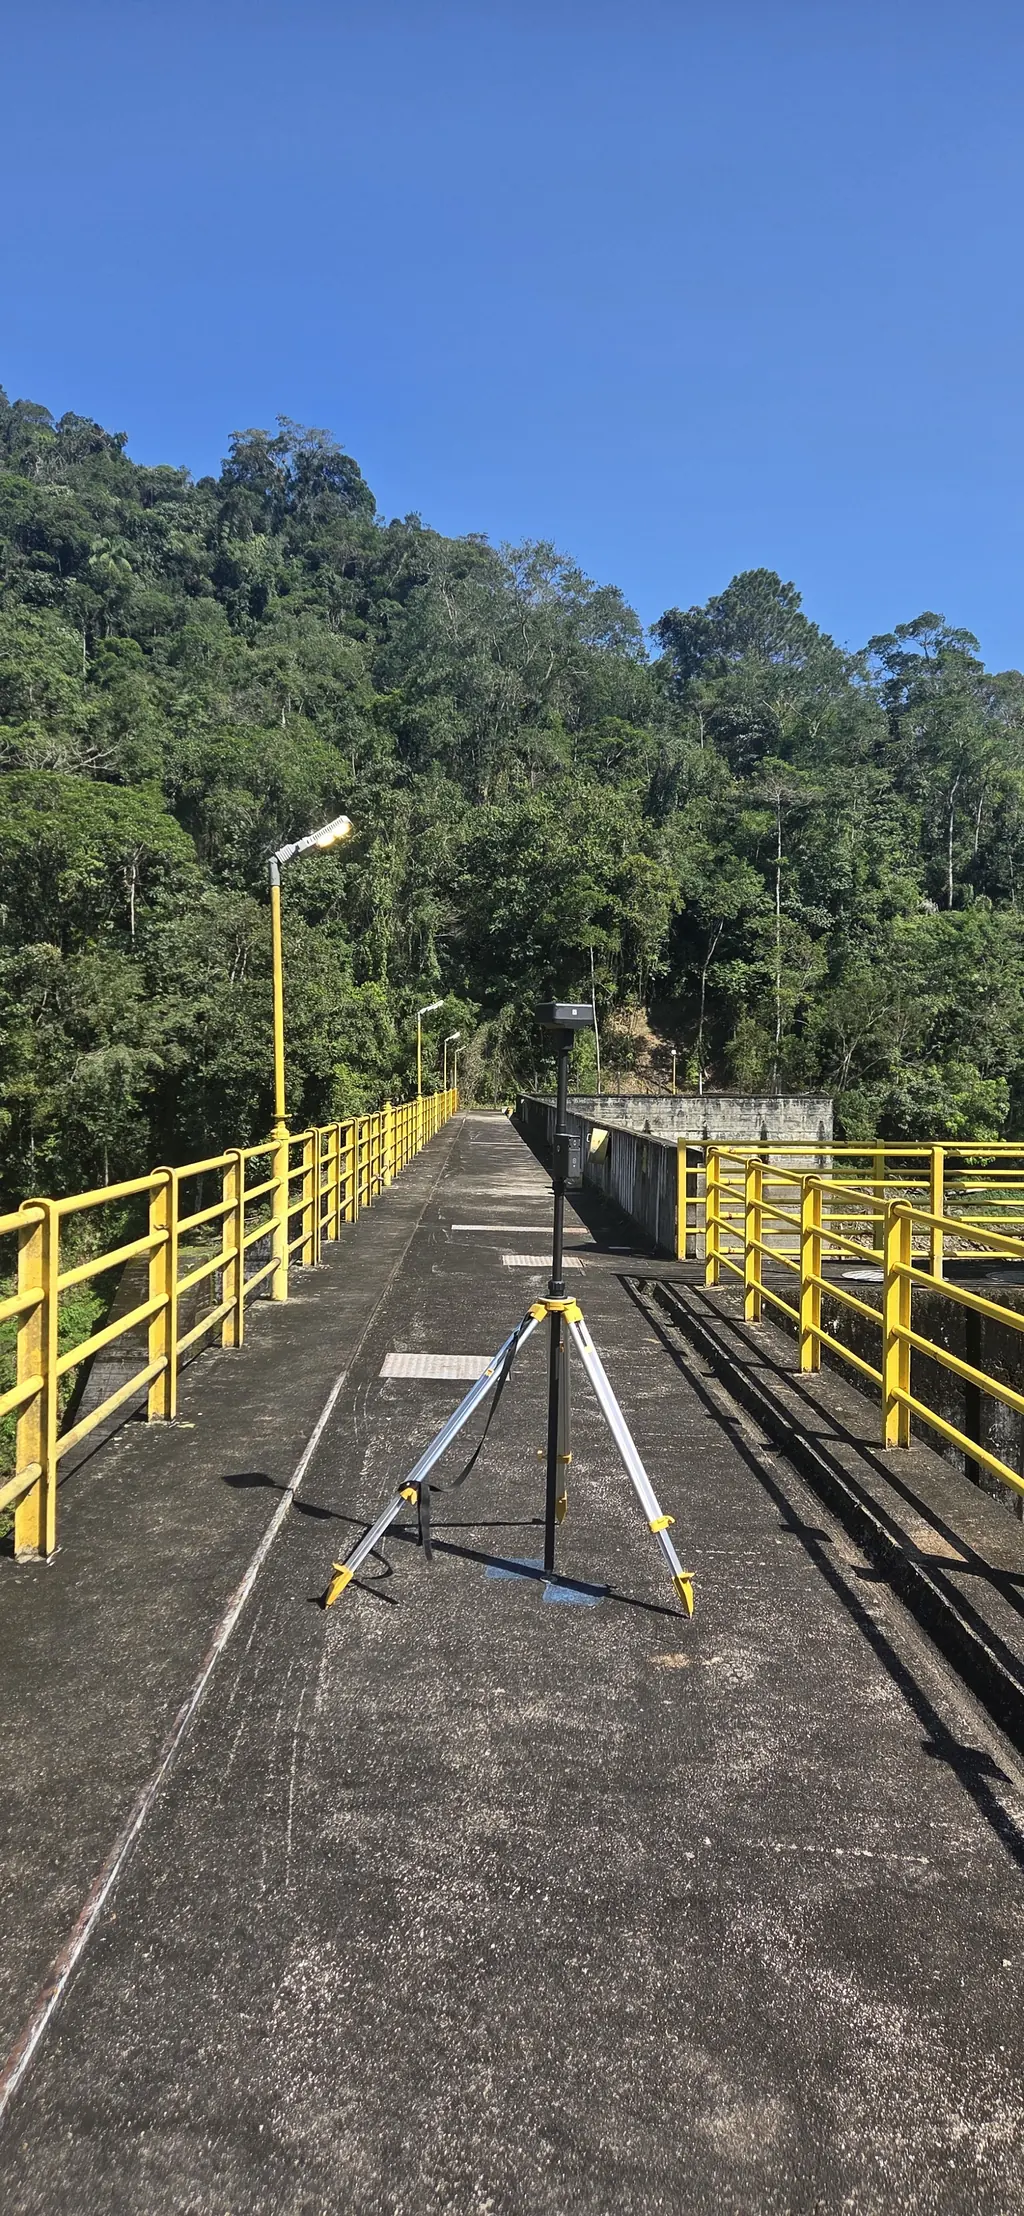
With the camera we use, our solar plant thermal surveys are usually flown at 25 m, for 3 cm per pixel. Here, the pylons are 27 m high and the cables come down to 10 m above the ground: flying below the lines was ruled out, and flying above them required a precise flight plan, set on the relief and on the height of the pylons. On Friday 17 July we therefore made a first visit for a LiDAR and photogrammetric reconnaissance survey, which provided the digital terrain model of the site.
On Monday 20 July, the infrared and visible flights were flown at 30 m above that model, following the terrain, with side overlap raised to 85% in the flight plan so that every panel could be seen between the cables. Infrared resolution went from 3 to 4 cm per pixel, which does not prevent the defects we look for from being detected; visible resolution stayed at 1 cm. Irradiance recorded during the flights was 1,100 W/m², well above the 600 W/m² threshold set by the IEC TS 62446-3 standard for thermography of photovoltaic installations.
Removing the cables in processing
On part of the images, the cables cross in front of the panels. Processing therefore took longer than usual: visible and infrared orthophotos rebuilt while removing the cables as far as possible, then the outlining of the 8,996 panels and the reading of each one’s temperatures. The report was checked and approved on 28 July, eight days after the flight, whereas the Le Carbet report had been approved the day after acquisition.
One record per flagged panel
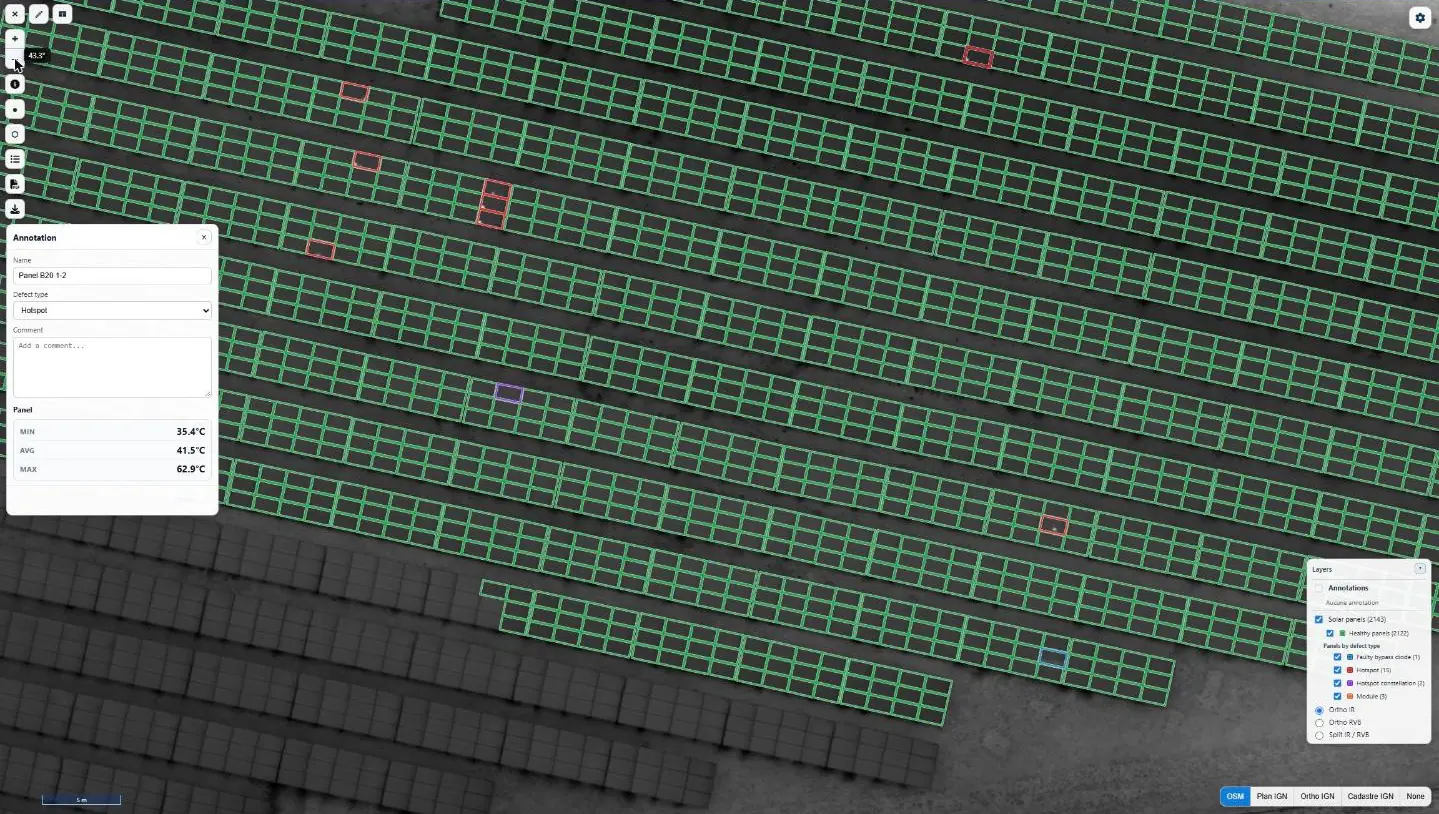
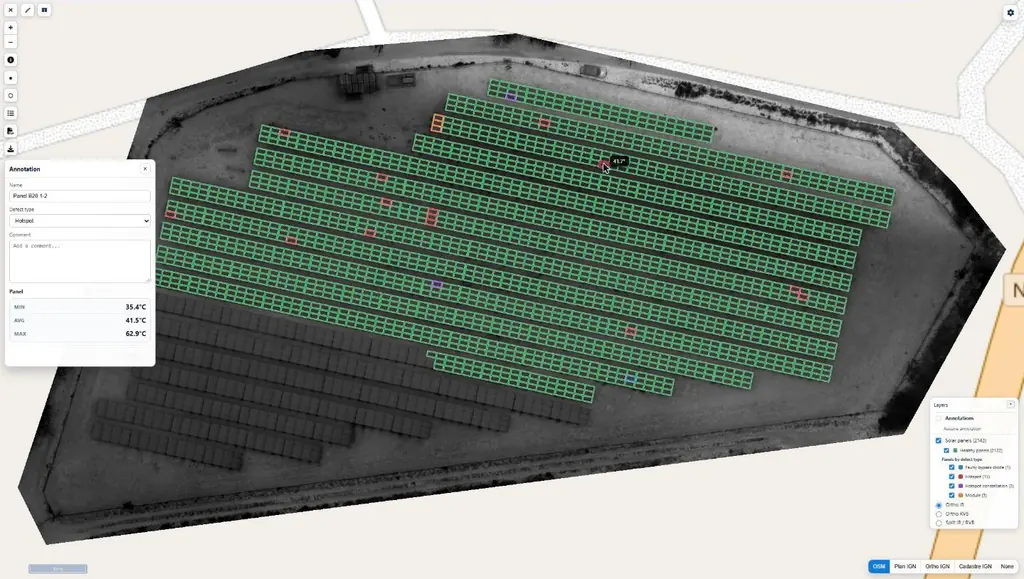
Every flagged panel has its own record in the detailed report: type of defect, infrared and visible images, minimum, mean and maximum temperatures, GPS position and directions for the maintenance team. Defects are sorted into the usual categories of photovoltaic thermography, from the single hot spot to the cut string, including shadows and soiling.
The results were delivered on 30 July: detailed report, one-page summary, defect plan and georeferenced orthophotos, also available in the Sentinel Cloud thermography module. The same month, Genergies entrusted us with eight ground-mounted plants in Guadeloupe, flown from 3 to 13 August, this time without any medium-voltage lines.