Three days on a hydroelectric plant on the São Francisco river, in Brazil
The plant stands on the São Francisco river, in the state of Bahia. Its dam is of mixed design, combining concrete and rockfill. For the engineering firm holding the operator’s contract, we carried out in January 2025 the photogrammetric acquisition and processing of the powerhouse, spillway, water intake and crest: a baseline to be compared in future inspections.
Working in an operating plant
Before entering the site, the team supplied its clearances for work on electrical installations, in confined spaces and at height (Brazilian standards NR-10, NR-33 and NR-35), wrote a method statement and a risk assessment specific to drone flights, and completed the operator’s safety induction.
From the general model to the faces
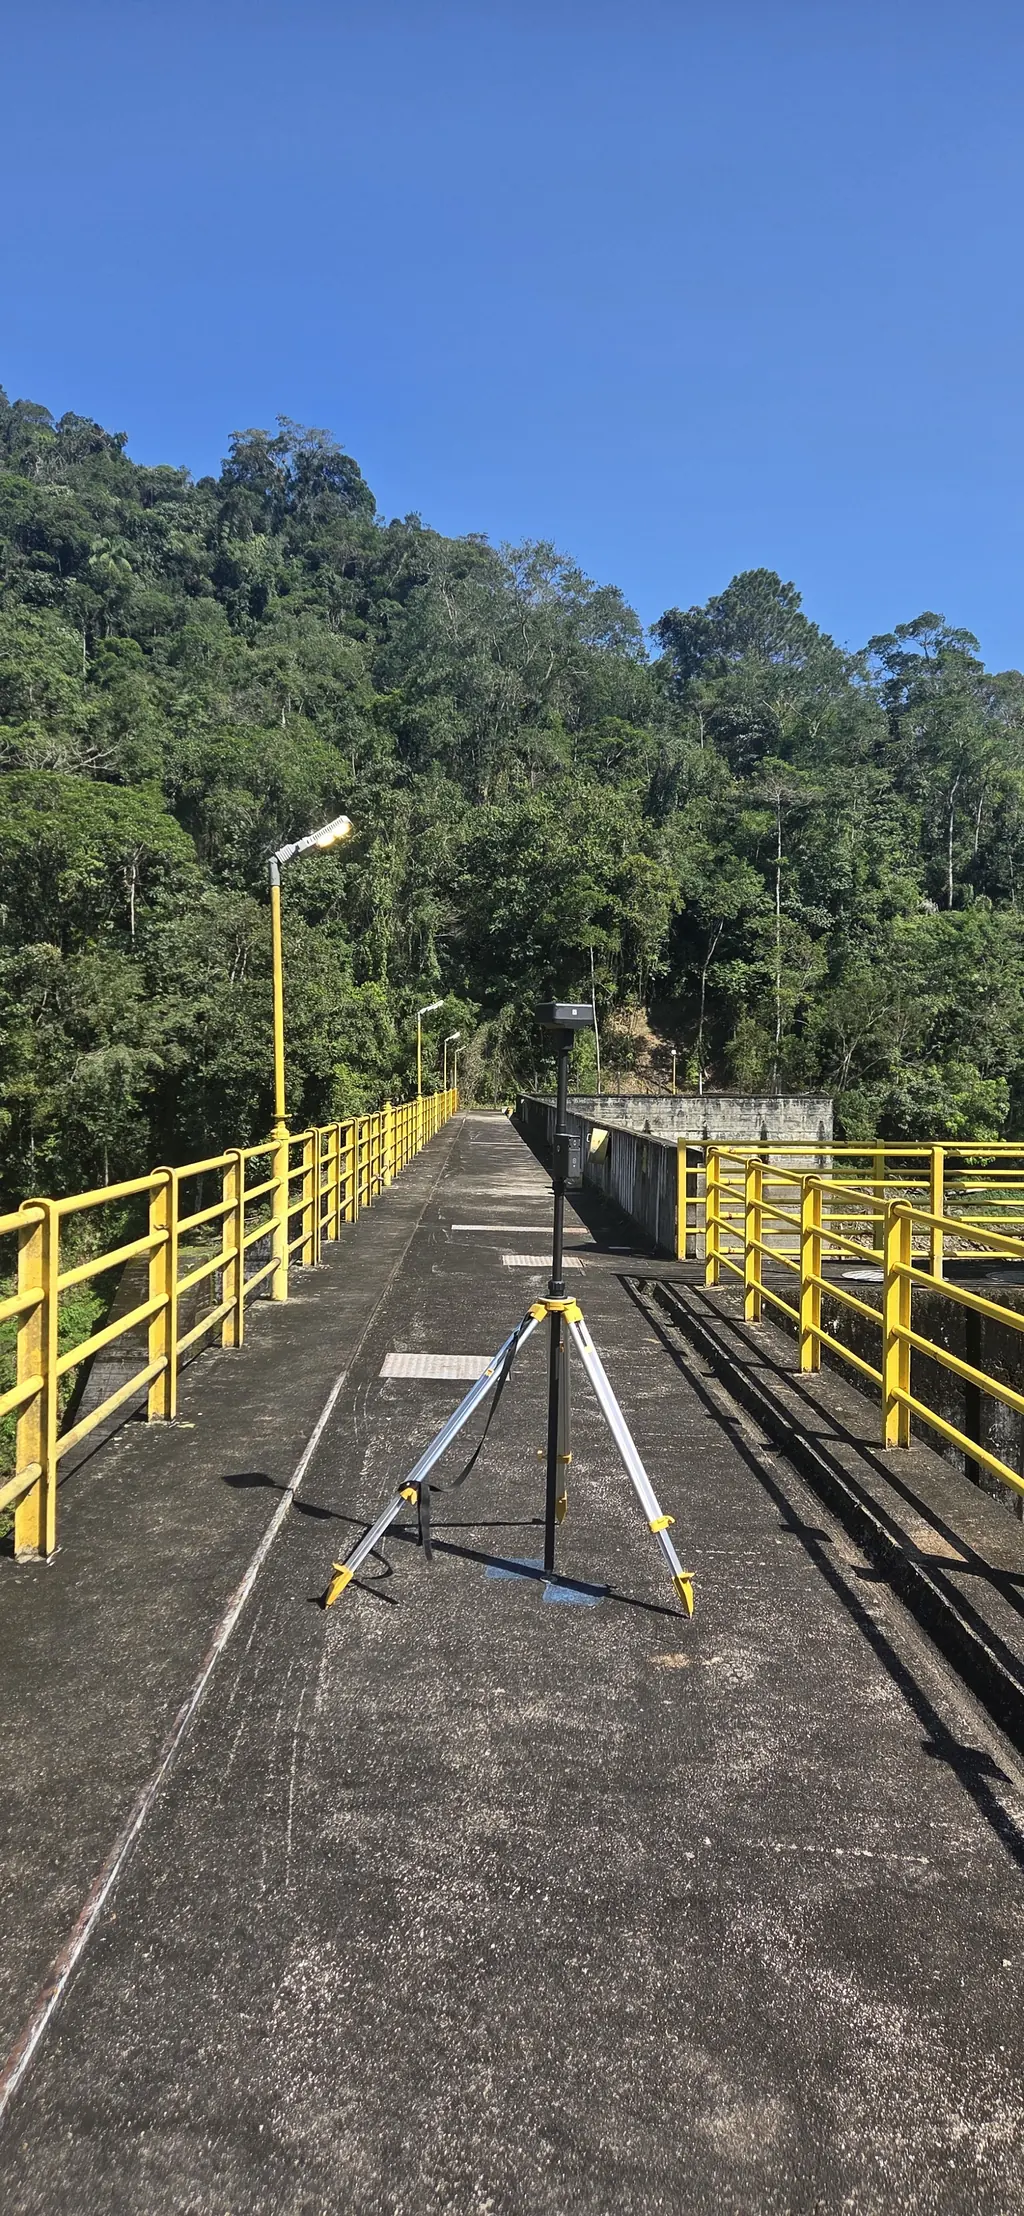
On site from Tuesday 21 to Friday 24 January 2025, two people, a pilot-photogrammetrist and an assistant in charge of batteries, RTK and safety, worked with a single compact RTK drone. Positioning was corrected in real time by a permanent station of the IBGE geodetic network 3 km from the dam: 2 cm horizontal and 3 cm vertical accuracy. On the first afternoon, general flights at 50 m with terrain following (1.5 cm per pixel) produced the 3D models of the powerhouse and spillway that same evening, on which the close-range flight plans were computed.
Over the following days the drone flew along the faces less than 4 m away, obstacle sensors set to 3 m, targeting 1 mm per pixel: upstream face of the powerhouse, water intake and part of the downstream face on day two; downstream complements on the powerhouse, then the downstream face, upstream face and crest of the spillway on day three; spillway complements, a 360° survey inside the galleries and the crest between the spillway and the powerhouse on the last morning. In total: 11,809 photos, 33 flights, more than 11 hours in the air and 66.5 km flown, under clear skies and without wind.
46 gigapixels, six types of anomaly
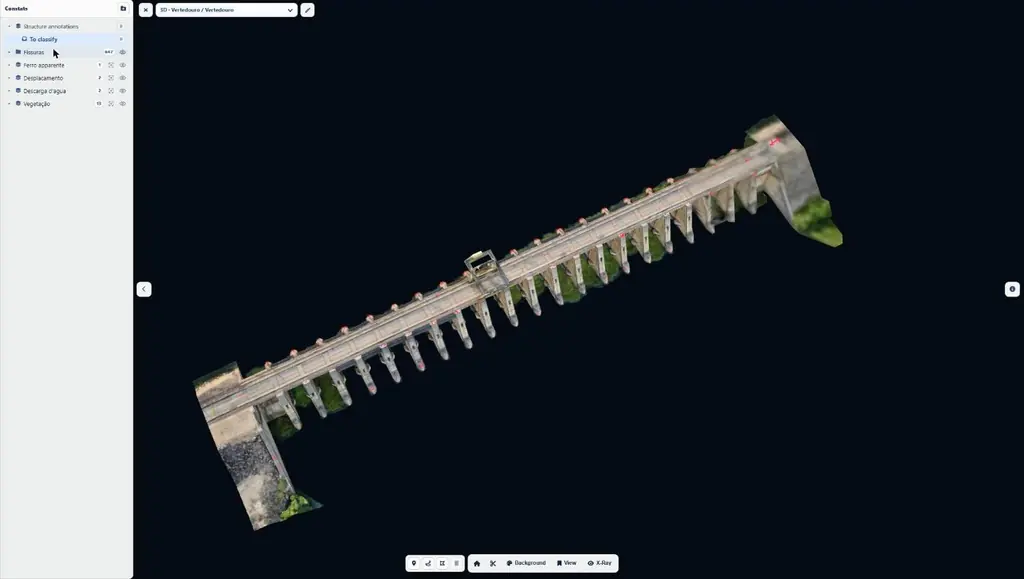
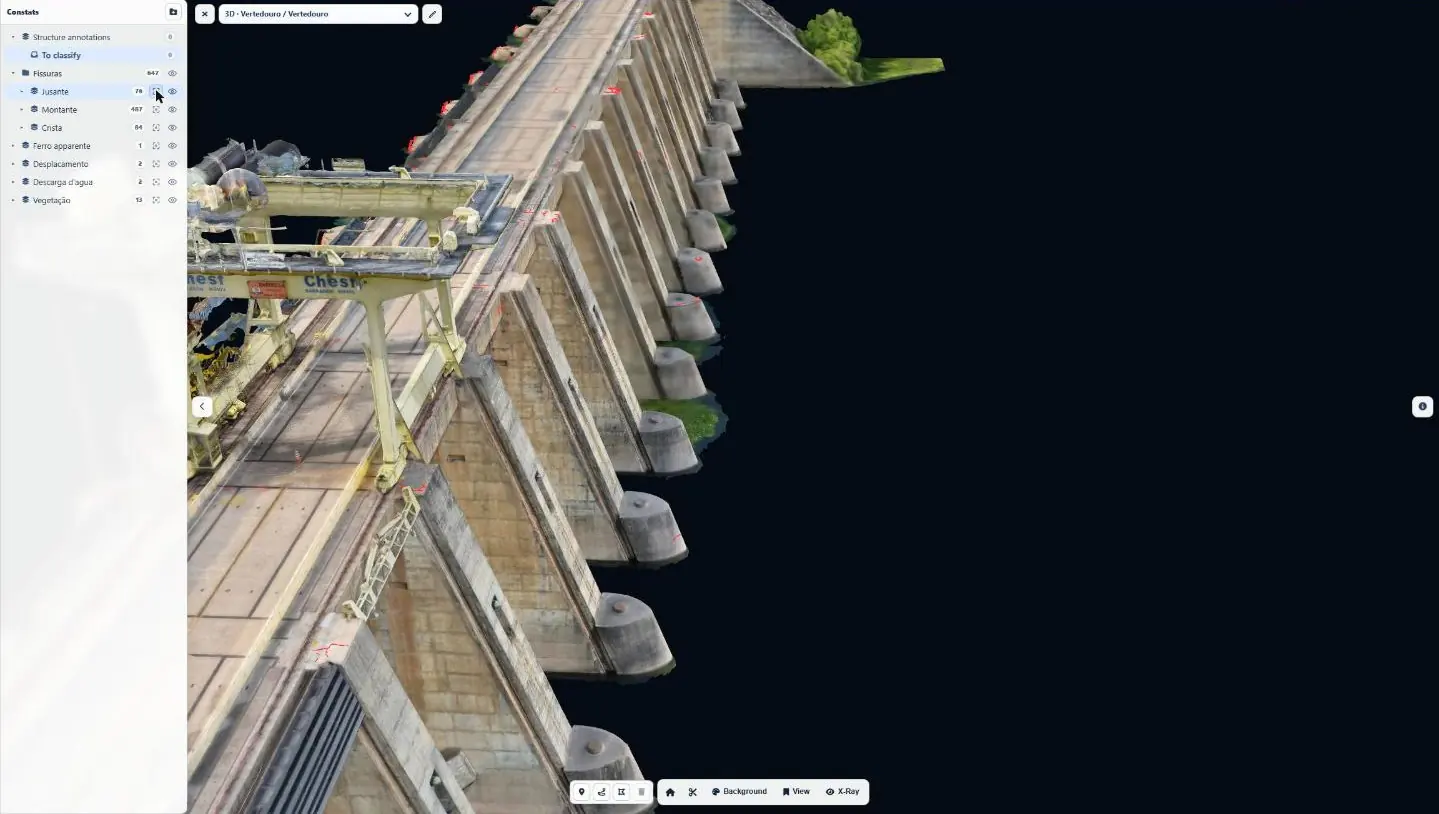
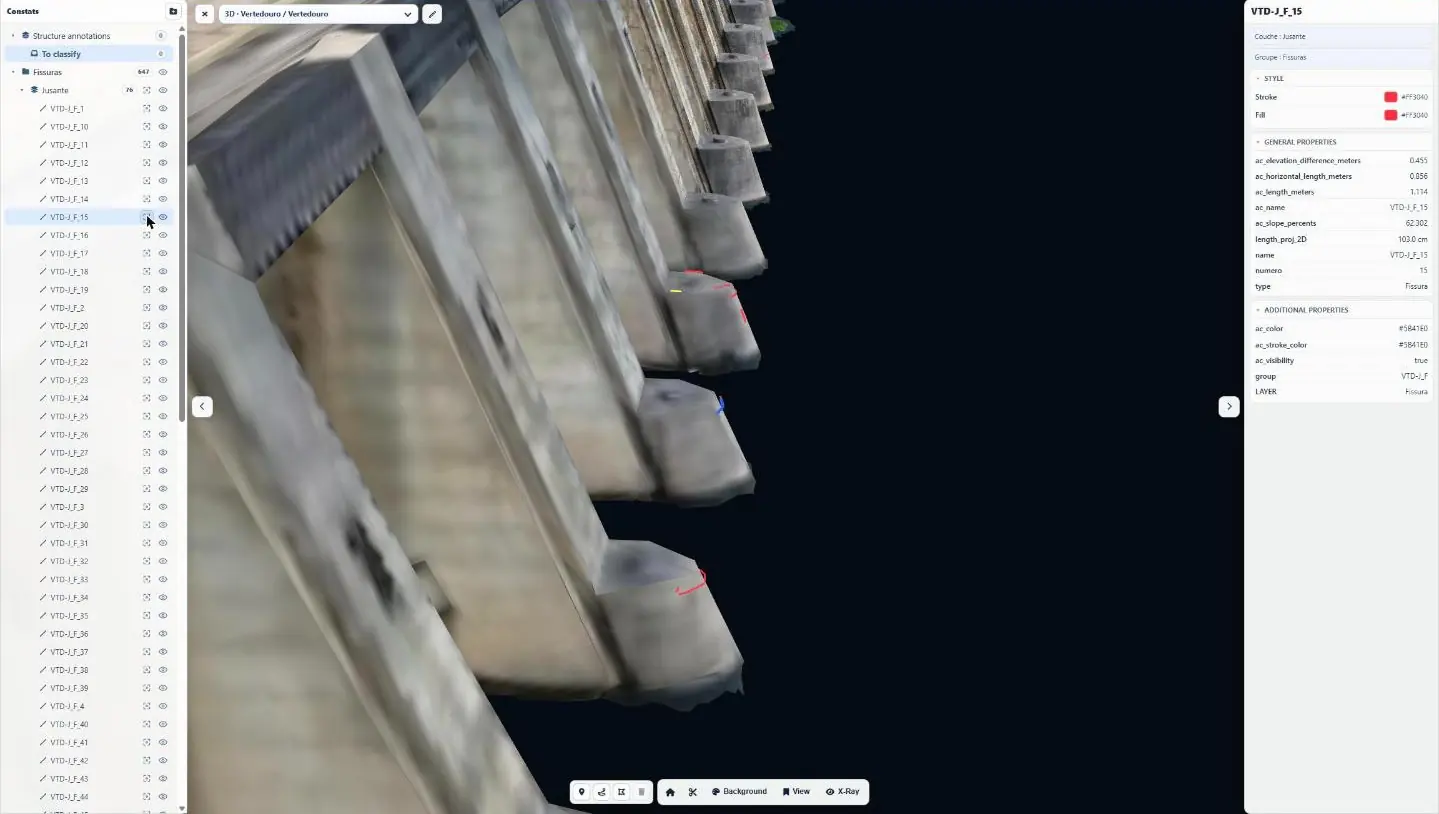
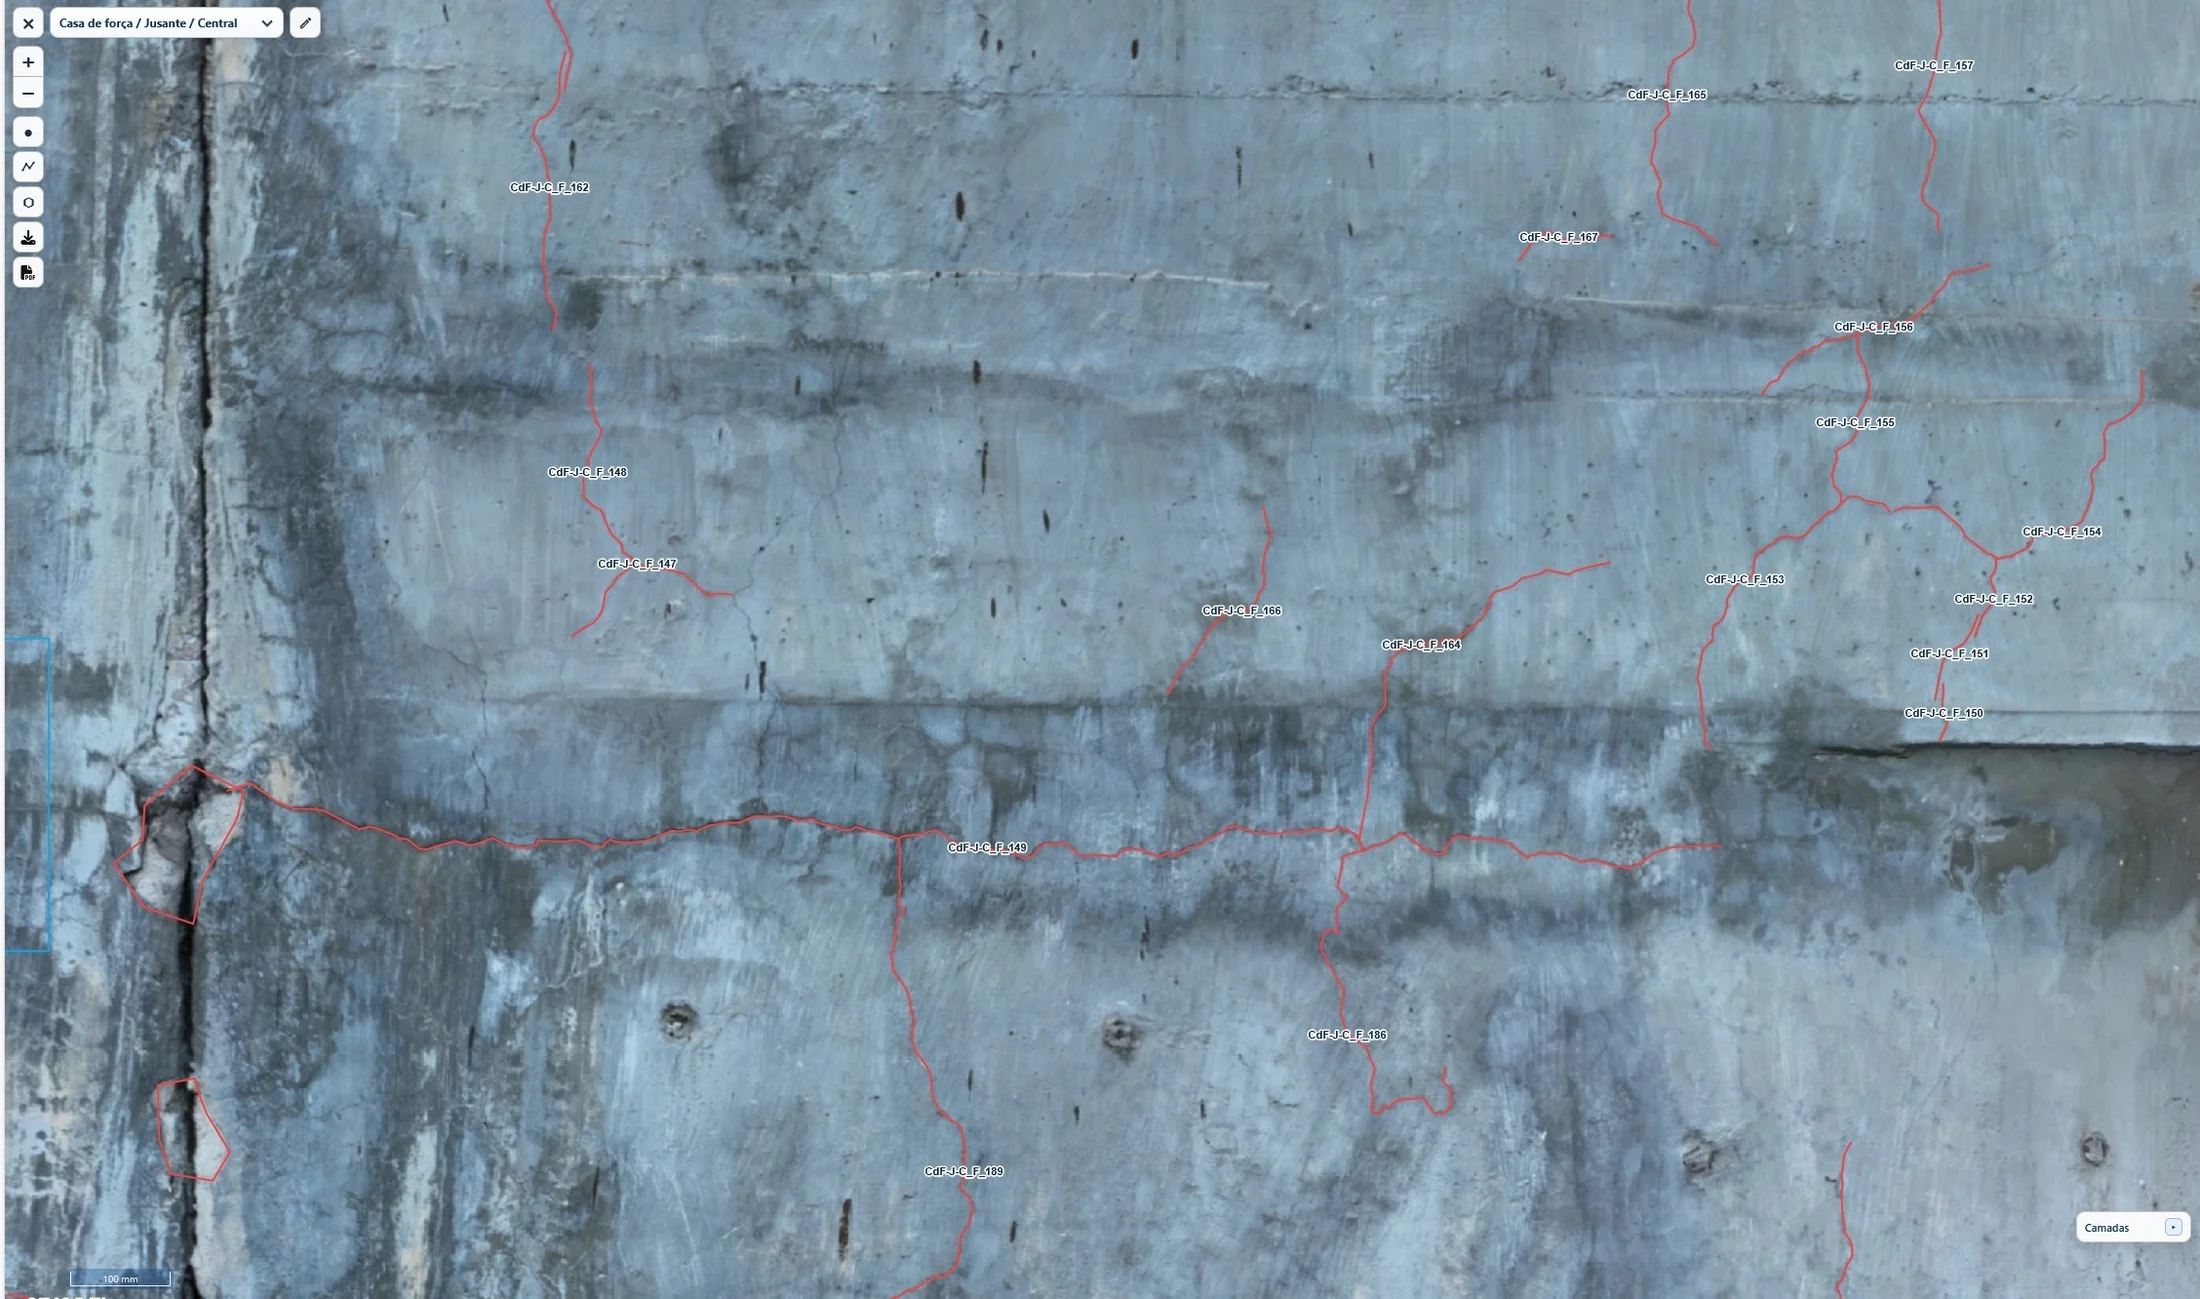
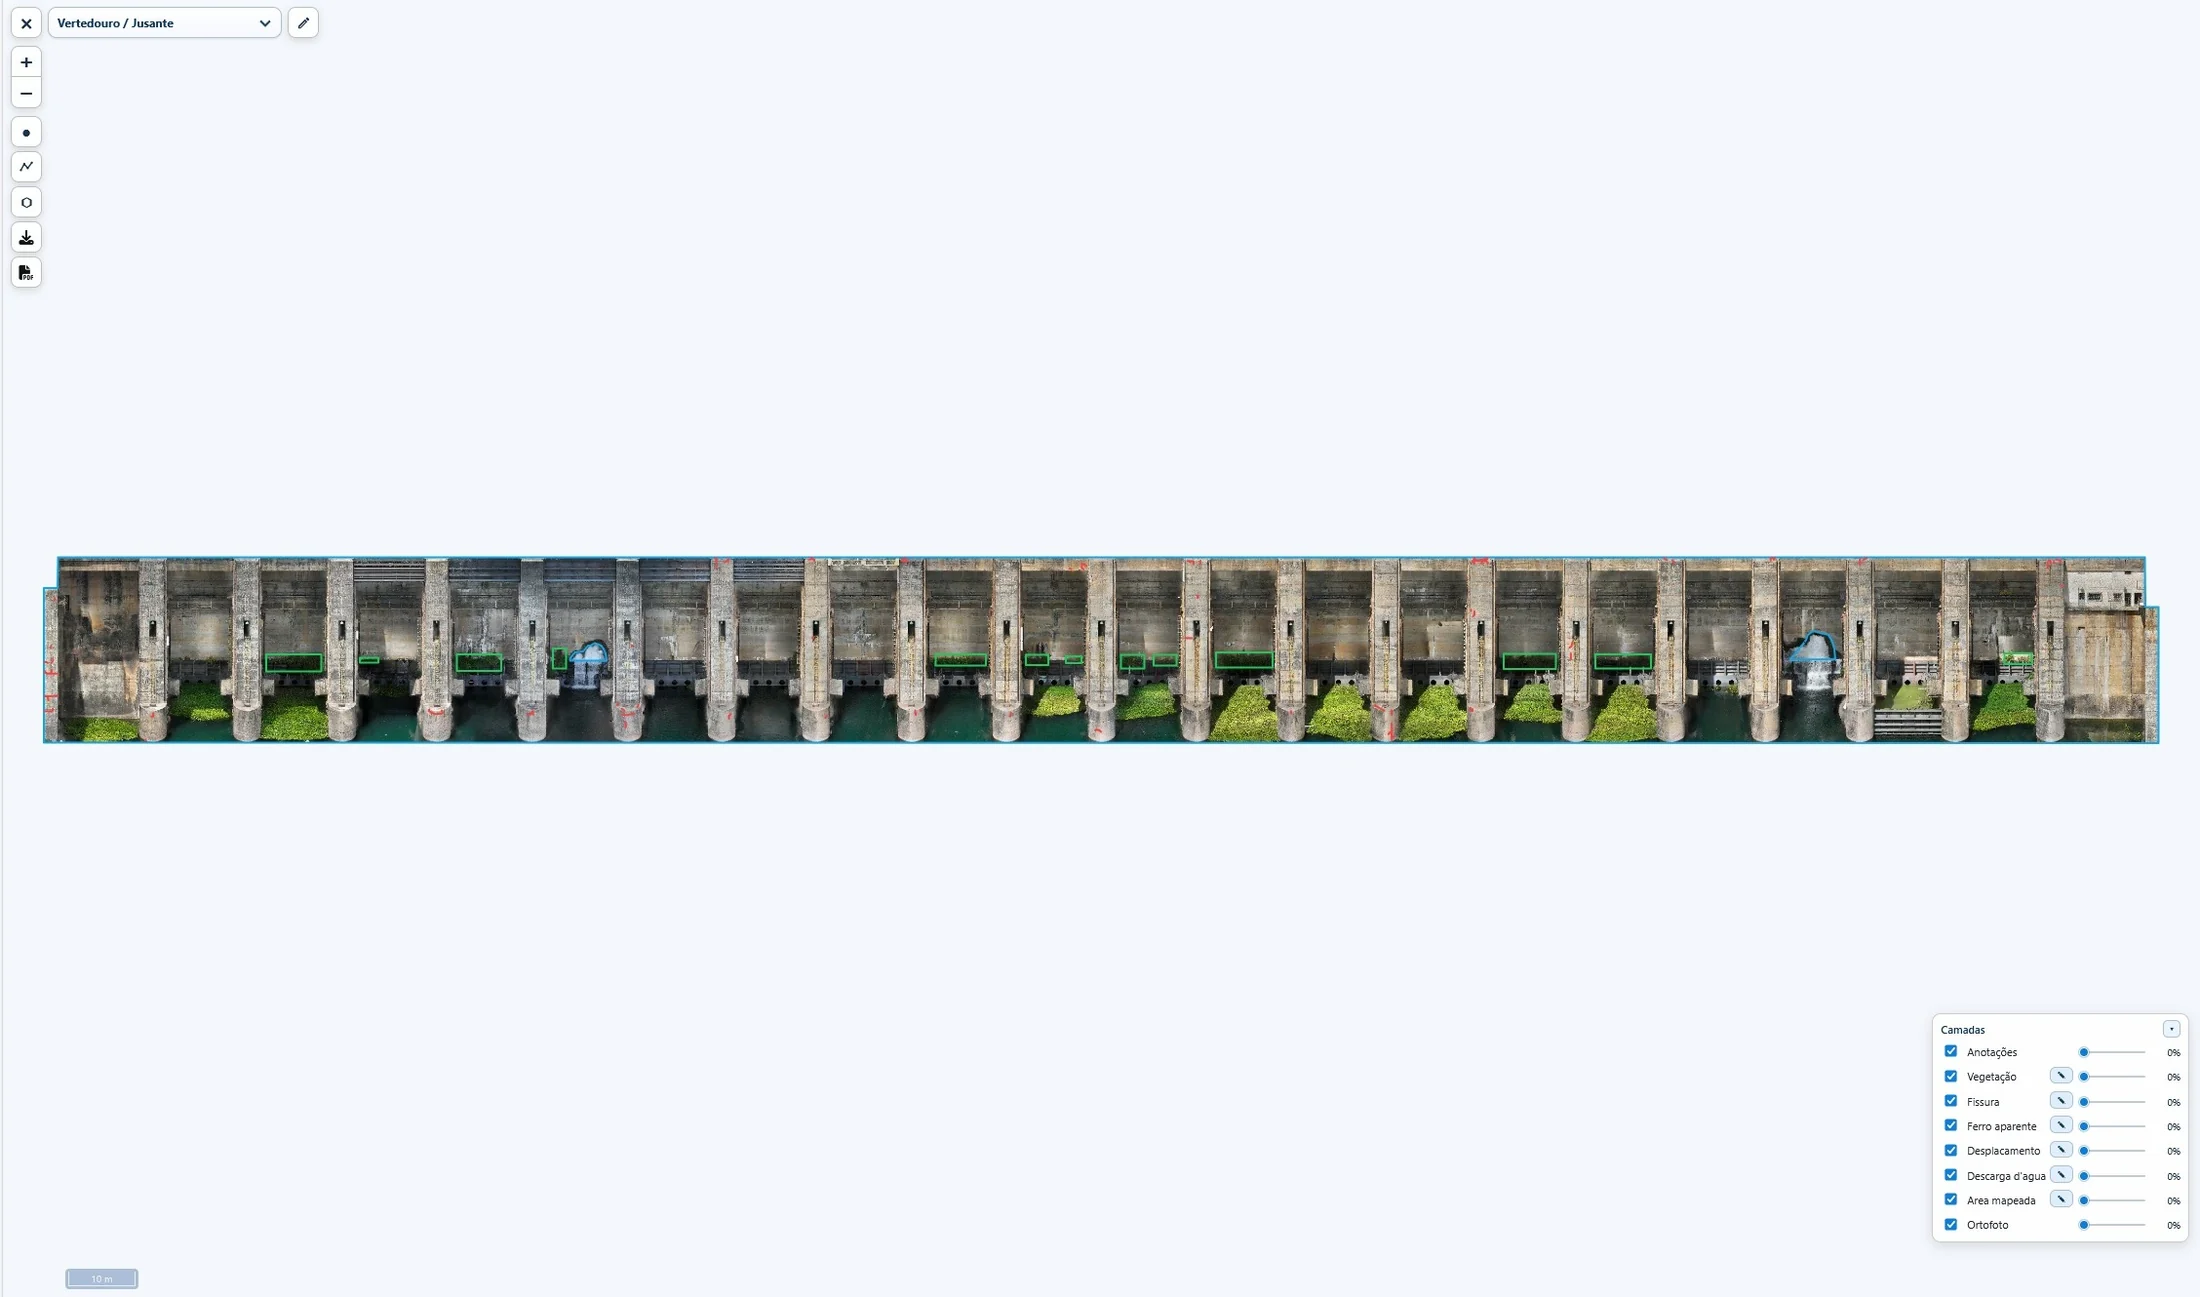
Ten working days of processing, with hundreds of manual adjustments, produced nine orthophotos totalling 46 gigapixels: 0.85 mm per pixel on the downstream face of the powerhouse, 1 to 1.22 mm on its upstream face and the water intake, 1.01 mm on the upstream face of the spillway and 3.08 mm on its downstream face, projected onto an inclined plane to limit the distortion of the piers, and 8 mm on the crest, georeferenced to better than 10 cm. They come with 3D models of the powerhouse and spillway, two trunnion beams modelled so that their cracks can be measured directly on the model, and a ten-panorama virtual tour.
Each anomaly has a name giving its zone, type and number, for example CdF-M_F_201 for a crack on the upstream face of the powerhouse. Six types are distinguished: crack, crack concentration area, concrete spalling, exposed reinforcement, water discharge and vegetation. In total, 2,492 anomalies were mapped, including 2,432 cracks totalling 2.65 km, with their projected length and their true 3D length: 1,765 on the powerhouse, 581 on the spillway and 145 on the crest. Given the size of the surfaces, the survey is not exhaustive; it sets a reference for future inspections.
A web interface for the engineers
The report, in Portuguese, was delivered on 18 February 2025 with access to the Sentinel Cloud web interface, the first we had delivered for a dam inspection: the nine orthophotos with their anomalies positioned, four 3D models (powerhouse, spillway and the two beams) and the virtual tour, available for one year in a web browser. After a technical meeting on 21 February, a video tutorial was added to the interface. On 27 February the operator filed the report in its project document system; in March it received the source code of the virtual tour and an edition of the report carrying its internal document number.