18,671 panels checked by thermography on eight ground-mounted plants in Guadeloupe
These eight ground-mounted plants in Guadeloupe export all their output: they sell their entire production to the grid, and a panel that overheats, or that tall grass shades, means energy lost every day. In August 2026 their operator asked us for a drone diagnosis, after the Le Carbet plant in June and the Bellefontaine plant in July, in Martinique. Five are in Le Moule, the other three in Petit-Canal, Saint-François and Gourbeyre.
Flying when the sun is highest
The flights took place from 3 to 5 August, then on the 13th for the last plant and for additional visible-light coverage of three others. The operator had warned us: no medium-voltage lines this time, but winding access roads, for which it recommended a high-clearance vehicle. Each site gets two acquisitions: one in infrared at 3 cm per pixel, the other in visible light at 1 cm. Irradiance, measured at every flight, stayed between 1,000 and 1,267 W/m², well above the 600 W/m² threshold set by the IEC TS 62446-3 standard for thermography of photovoltaic installations: below it, the temperature differences caused by defects become too small to read reliably.
The eight plants add up to 8.1 MWp and 3.4 hectares of panels. The areas of isolated modules reported by the operator are outlined on the maps without being counted as defects.
One defect, one record
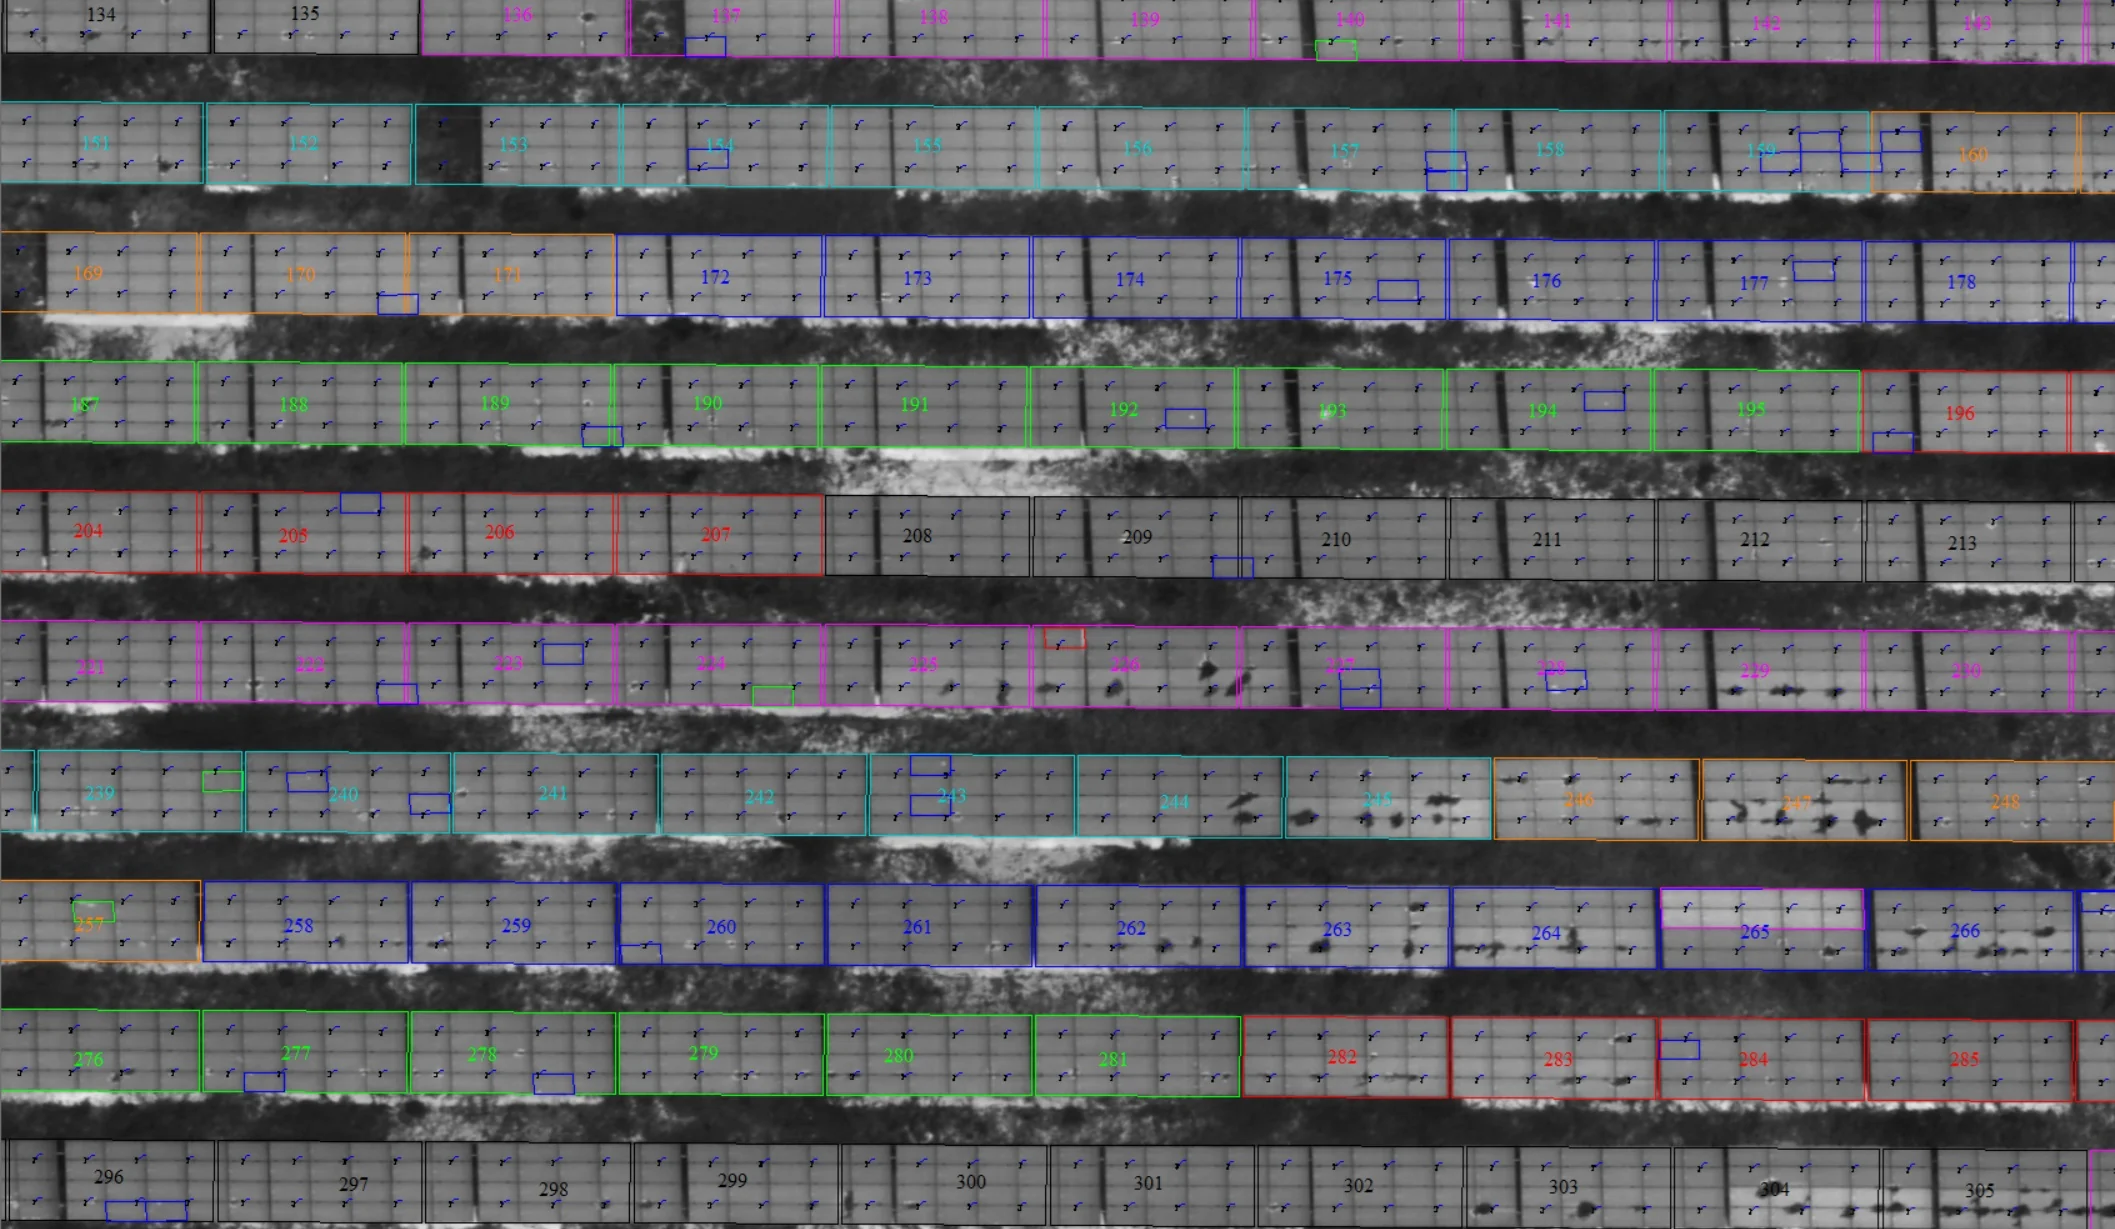
Every panel showing an anomaly is classified by type of defect, which guides the response: module defect, shading by vegetation, clusters of hot spots, single hot spot. Cases classed as ‘other’ carry an operator’s comment (possible soiling or condensation, impact, crack) and need checking on site.
Vegetation accounts for nearly three anomalies in ten, almost all of them on two plants: the fix there is mowing or clearing, with no equipment to replace. Module defects, on the other hand, are spread across seven plants and call for panel-by-panel work.
One file per plant
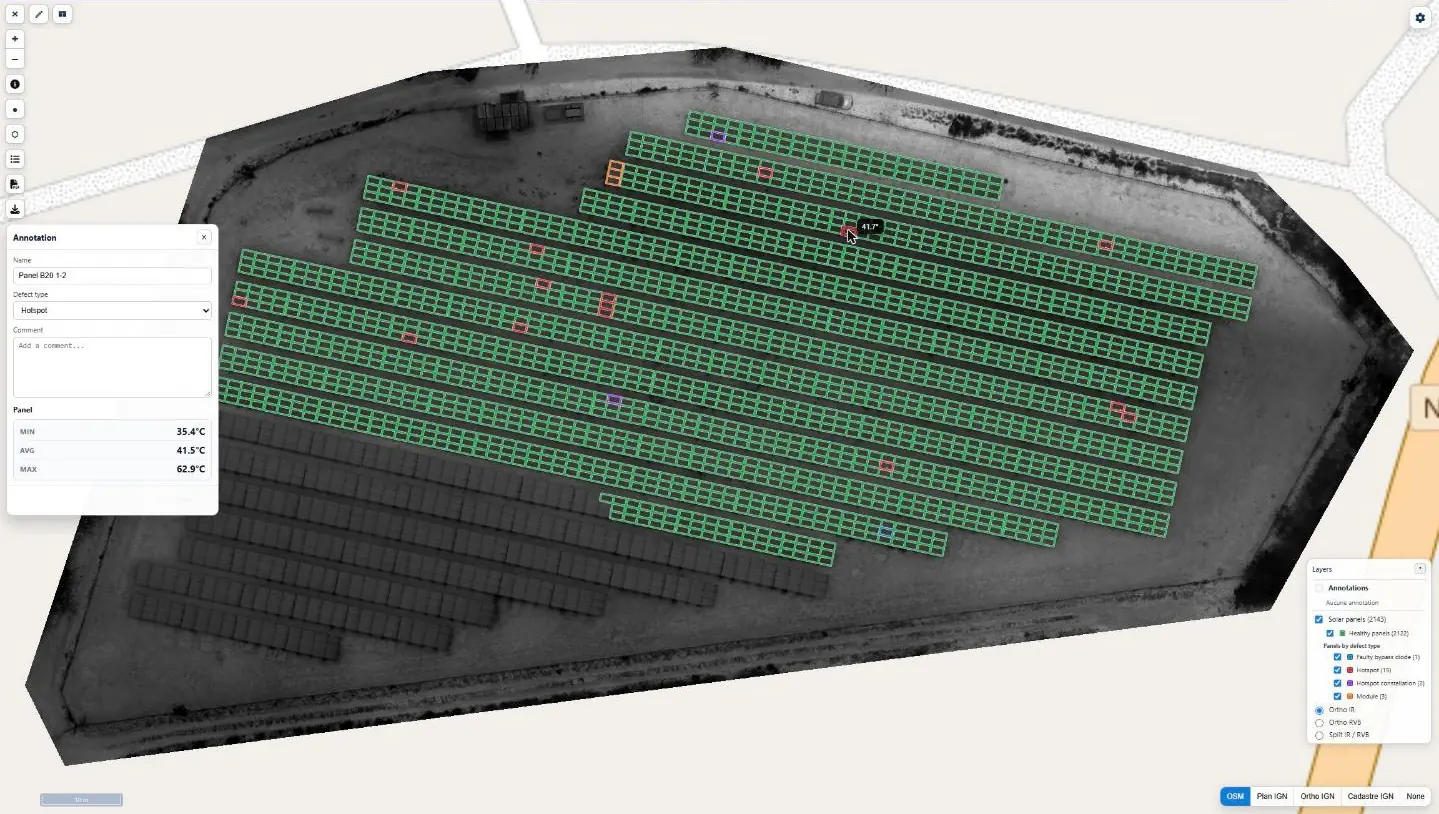
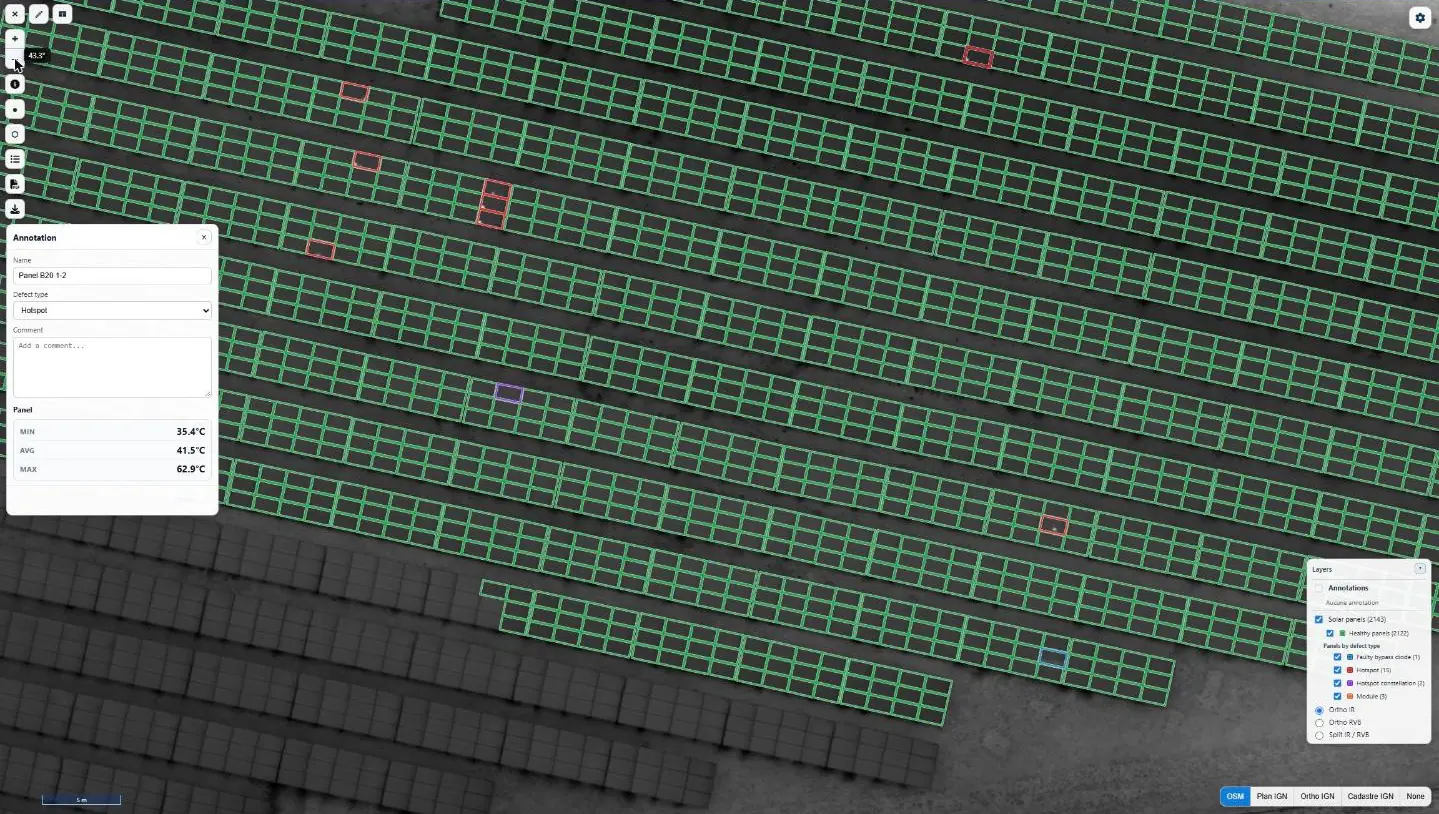
Each plant receives a detailed report with a record for every flagged panel: infrared and visible images, minimum, mean and maximum temperatures, GPS position and directions for the maintenance team. It comes with a one-page summary, a defect plan and georeferenced visible and infrared orthophotos. Every report is checked by a second operator; the whole set was approved on 19 August, six days after the last flight.
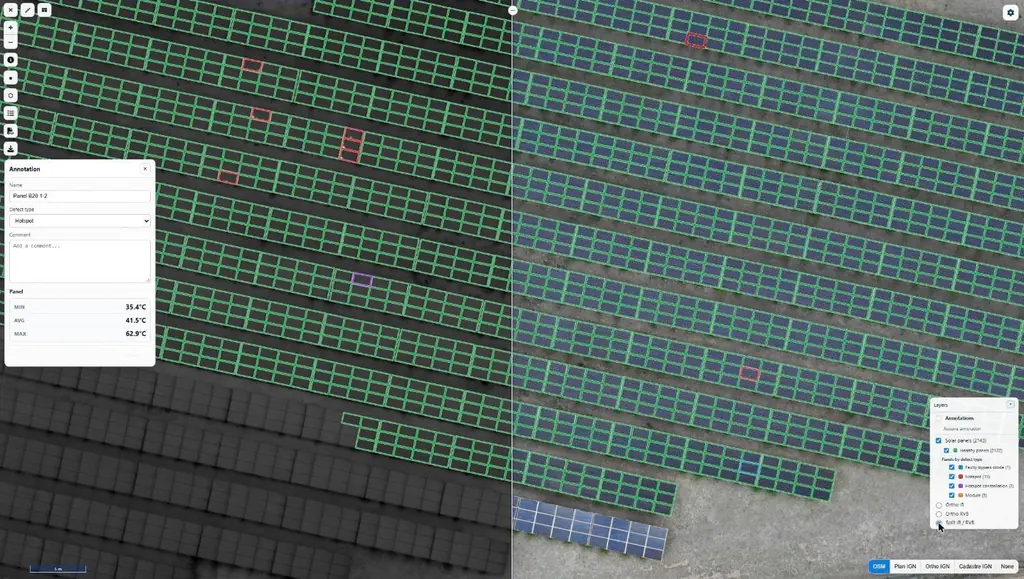
The same results can be viewed in the thermography module of Sentinel Cloud: the plant map first, then each panel in infrared and visible light, with its temperatures.