Peti dam baseline: 4,052 cracks mapped at 0.8 mm per pixel
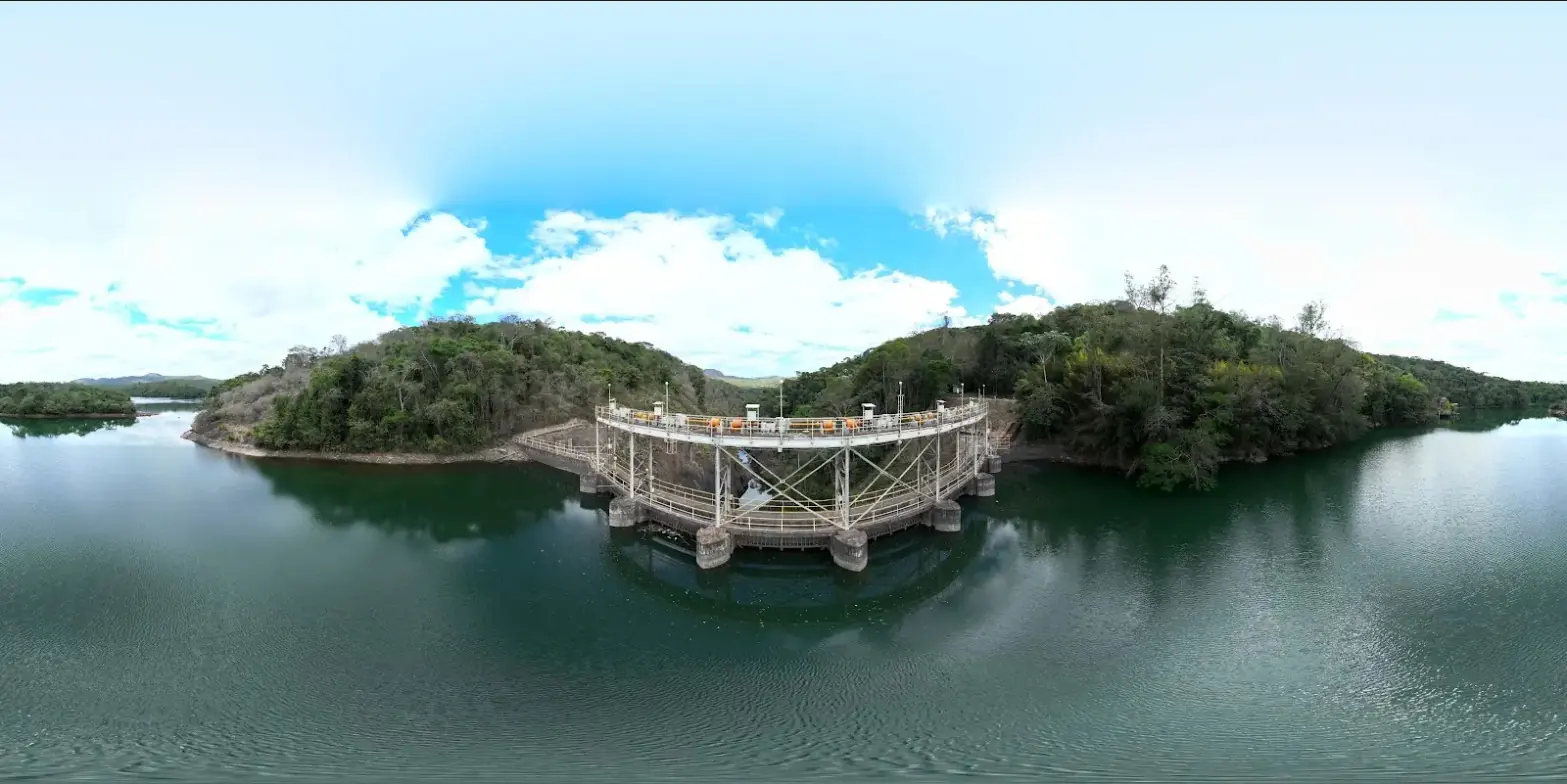
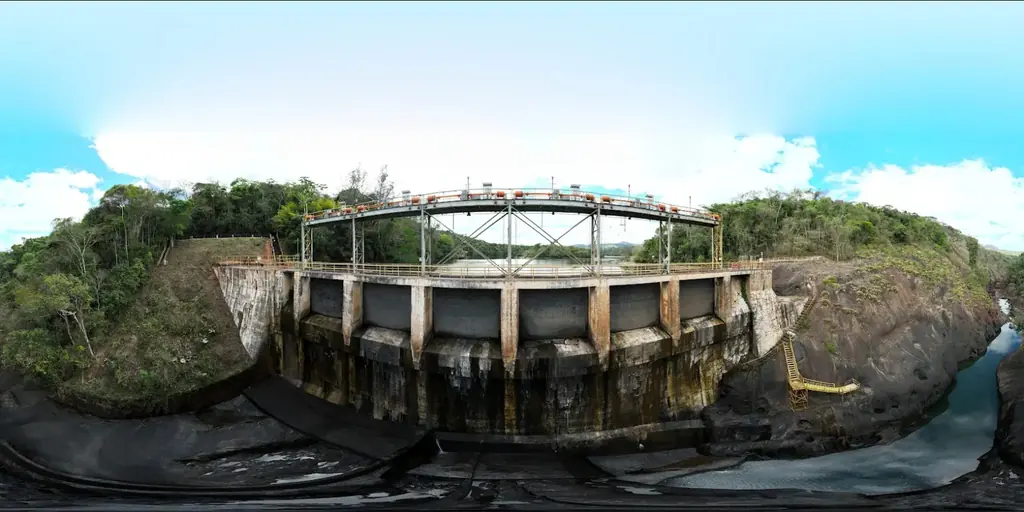
In September 2022, Cemig asked us to establish the baseline of the downstream face of the Peti dam, a concrete arch built in 1944-1945 on the Santa Bárbara river and affected by alkali-aggregate expansive reactions. Data from a 2020 campaign, produced with a different projection, had not allowed an accurate comparison: we had to start again from a complete reference, designed from the outset to be repeated every year.
From the general model to the face
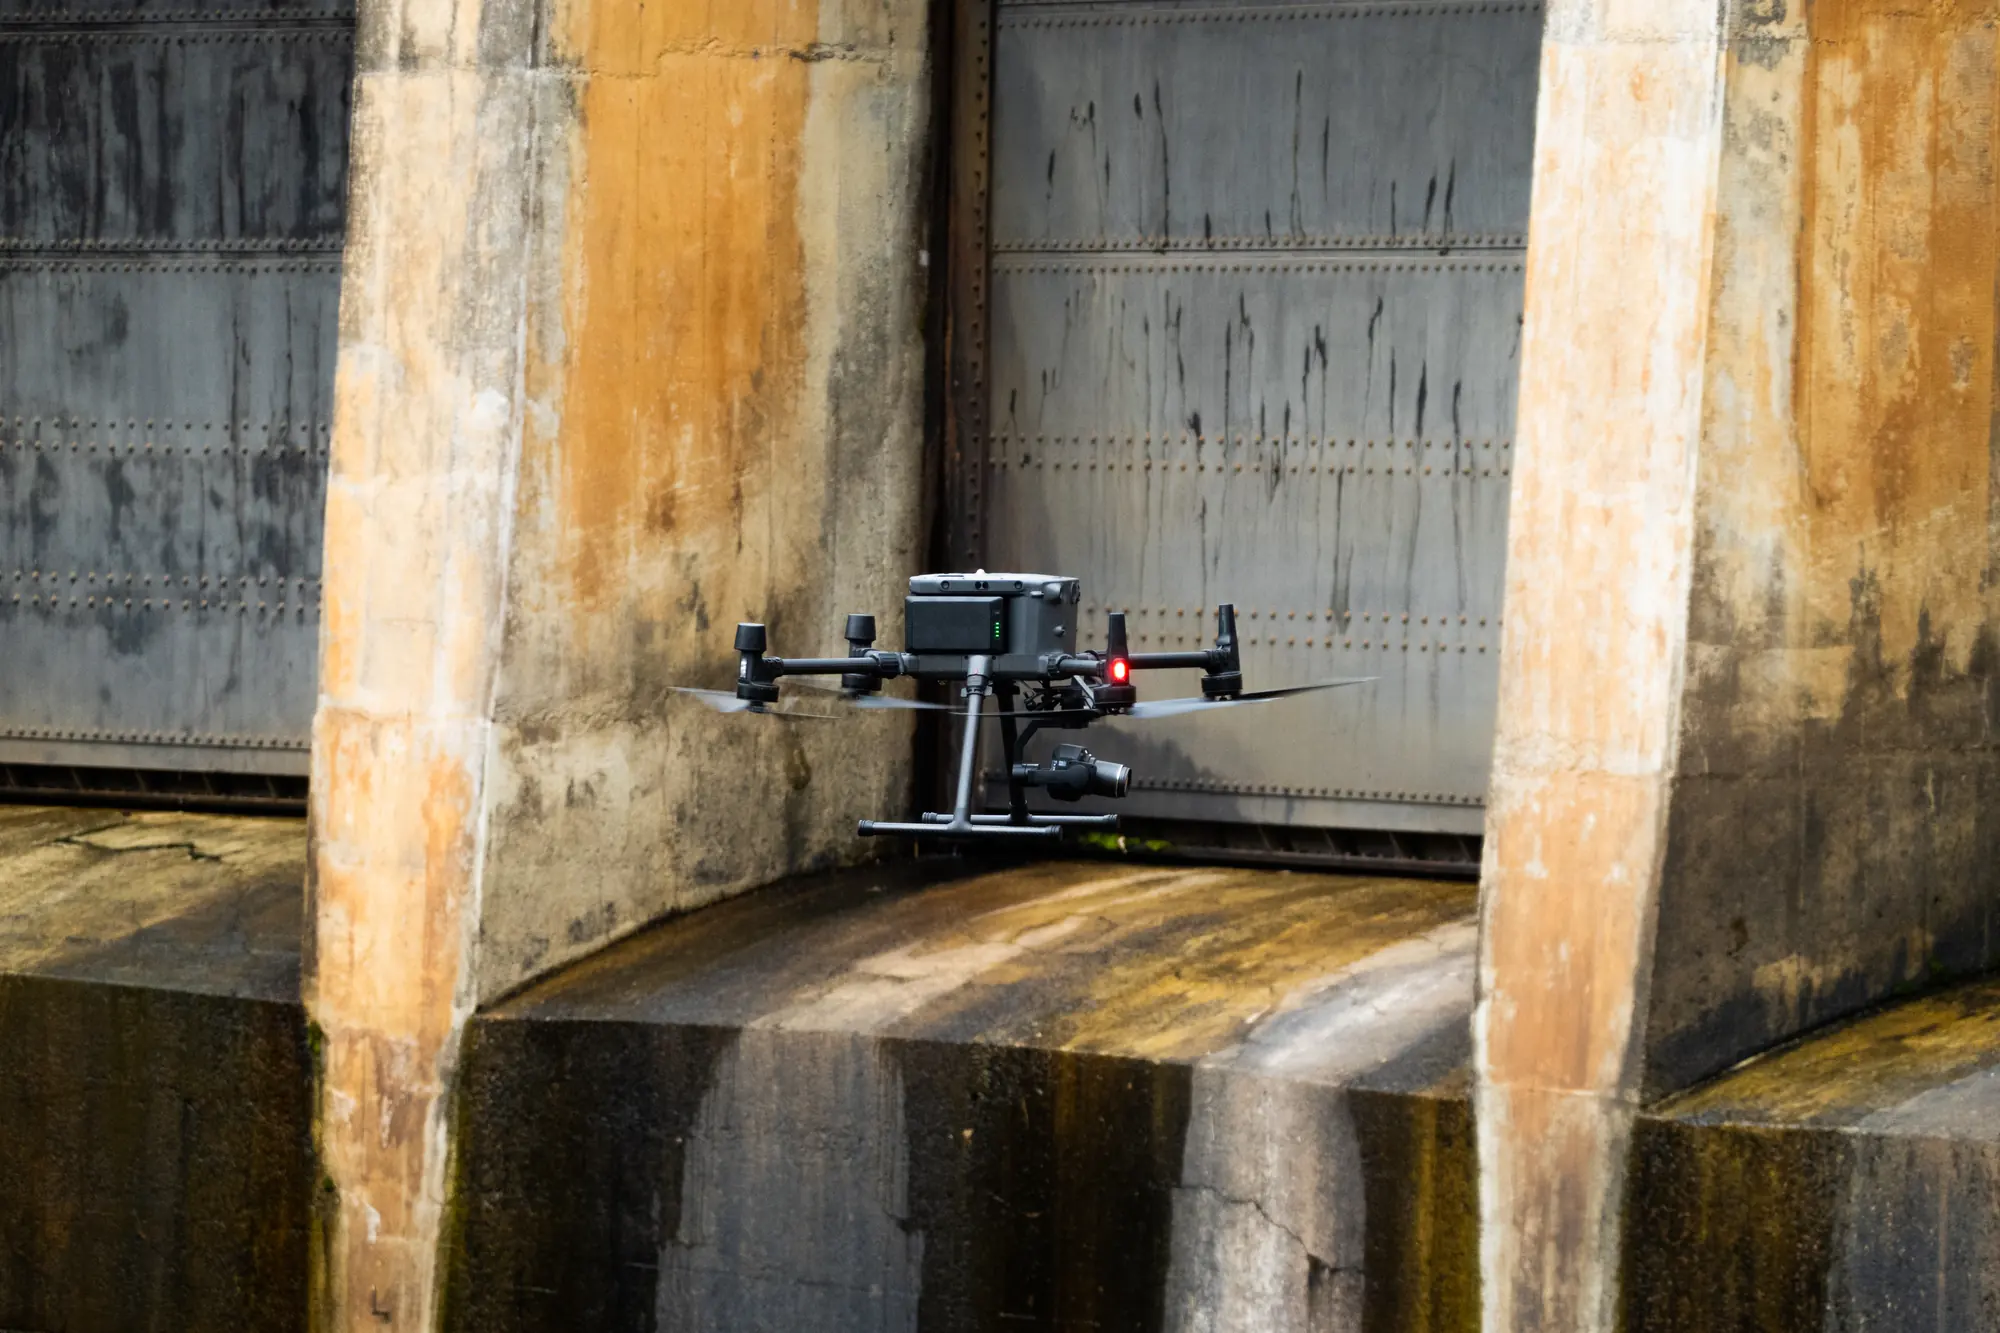
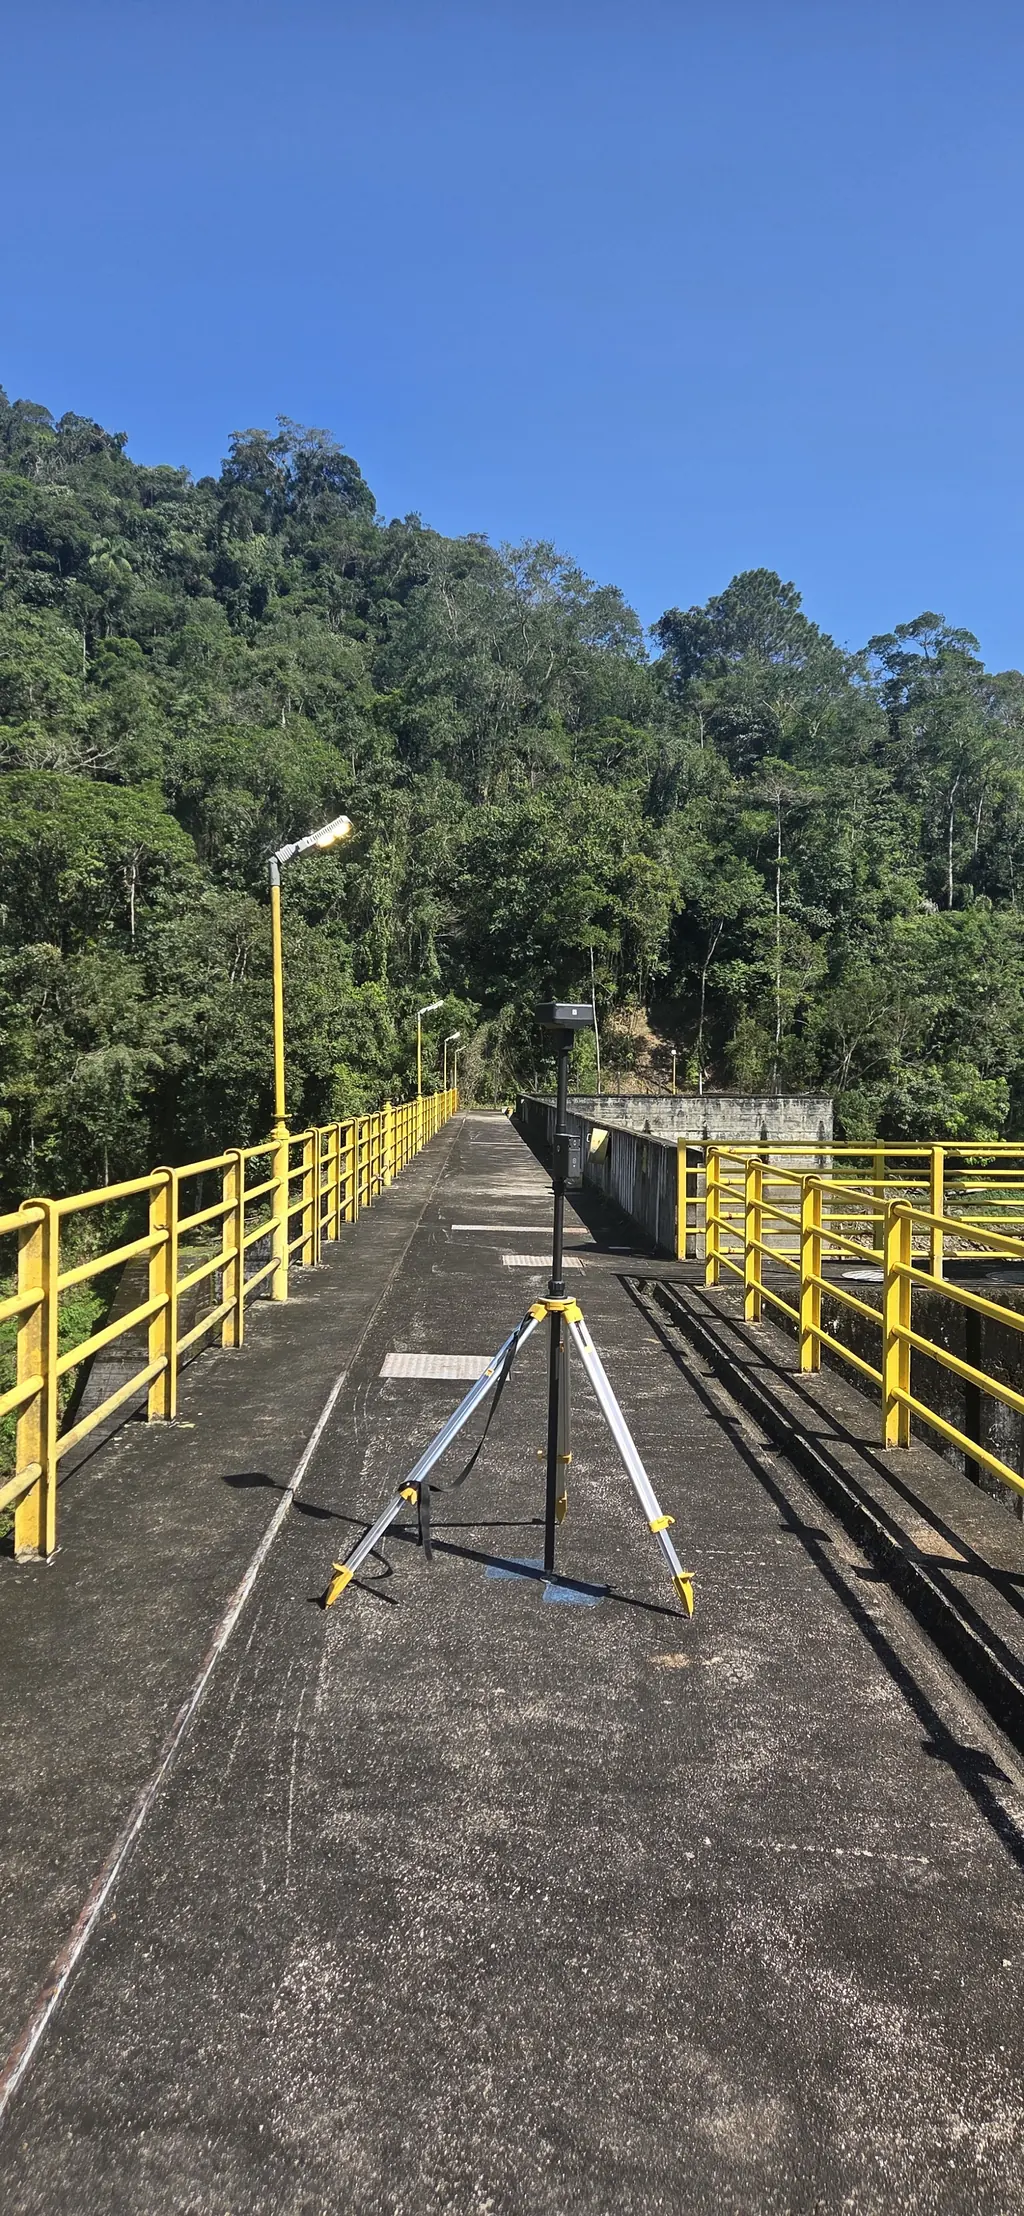
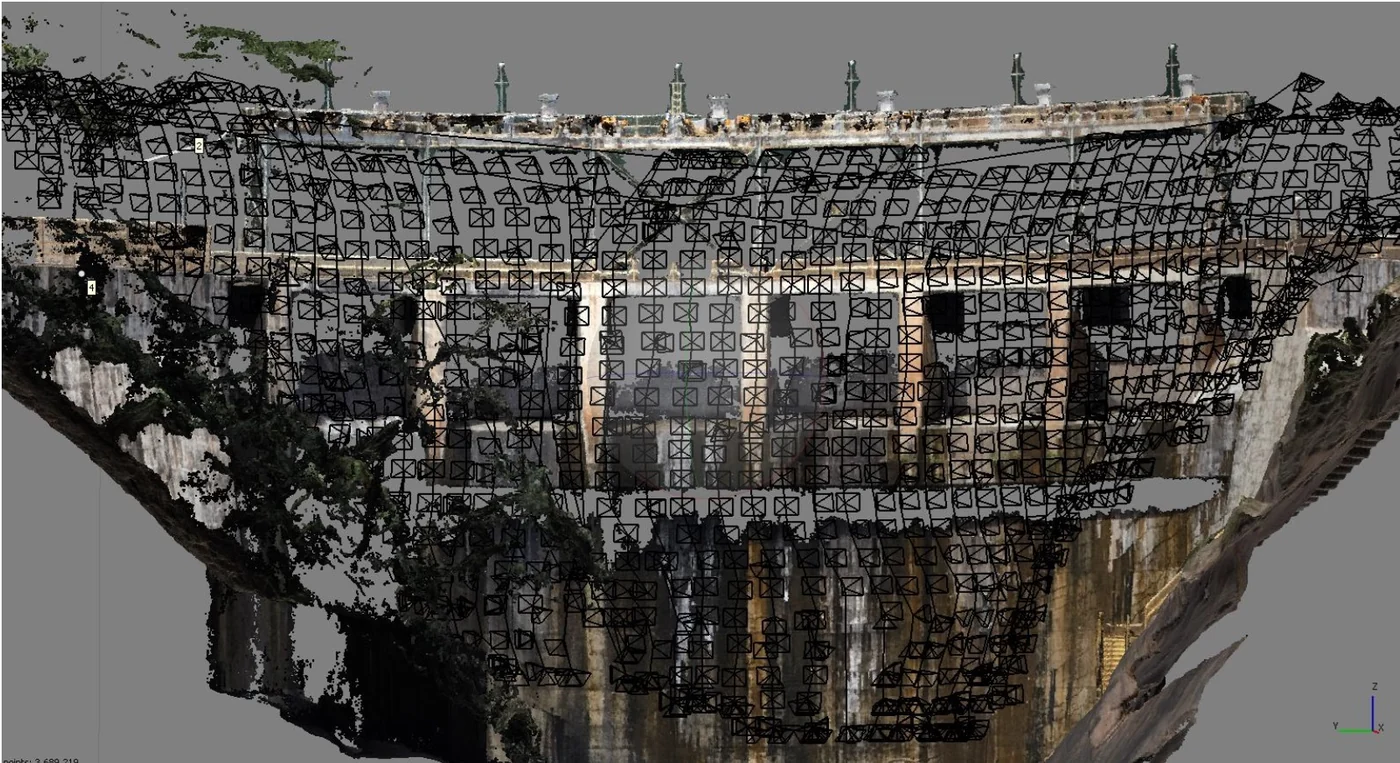
From 26 to 30 September 2022, the GNSS base was set up on a concrete benchmark on the left bank, which has been used at every campaign since. A multirotor RTK drone with a 45-megapixel full-frame sensor first flew a general survey of 932 photos: filtered point cloud, 2.2 cm digital elevation model, 3D model and 1.1 cm orthophoto. On this model we computed a 3D flight plan of 1,400 photos 6.5 m from the downstream face, i.e. 0.8 mm per pixel; the difficult weather that week set this minimum distance.
The upstream face, photographed in manual flight with a compact RTK drone, produced three orthophotos at 1.5 to 3 mm per pixel. The eight ogival spillway piers do not lend themselves to orthophotos: they were documented with three photos each.
Three face orthophotos and a tree classification
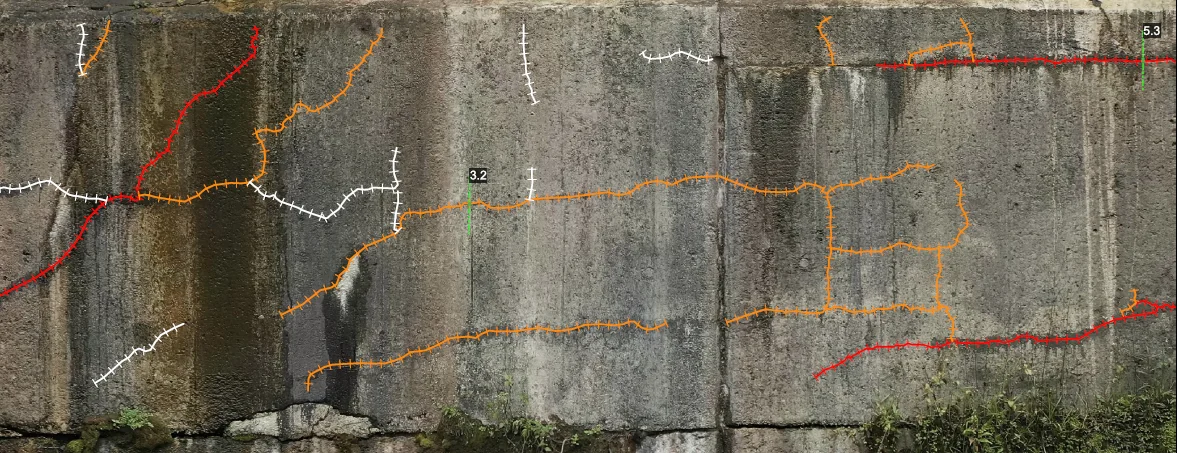
The downstream face was reprojected onto three face orthophotos at 0.8 mm per pixel, one cylindrical for the arch and two planar for the side blocks, with 1.6 mm elevation models. Cracks were drawn one by one, then classified following a tree logic: the rachadura is the trunk, the trinca the main branch and the fissura the secondary branch. Isolated features are classified by thresholds that are multiples of the pixel size: under 0.8 mm wide and under 1 m long for a fissura, 0.8 to 2.4 mm and 1 to 5 m for a trinca, beyond that for a rachadura.
Thanks to contrast, a crack remains detectable down to about a third of a pixel, 0.27 mm; the finest one recorded is 0.4 mm wide.
4,052 cracks over 2,023 m
The baseline counts 4,052 cracks: 2,128 fissuras, 1,328 trincas and 596 rachaduras, with a cumulative length of 2,023 m, of which 433 m, 747 m and 843 m respectively. Density maps for each family show where the concrete is working hardest.
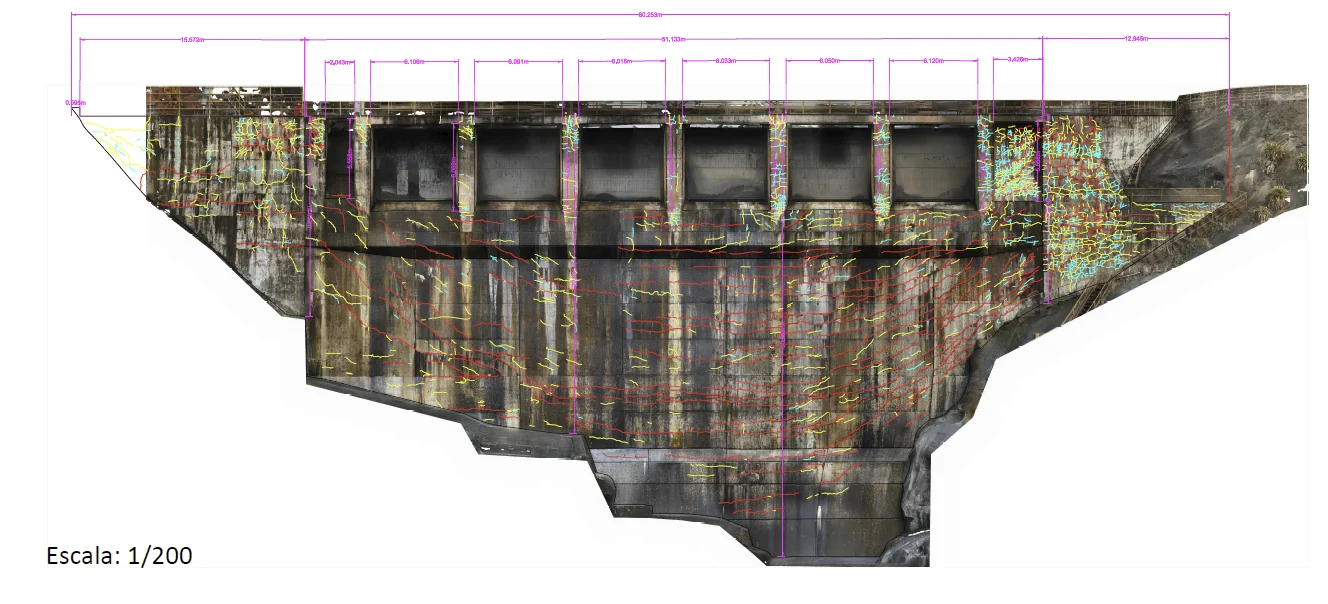
Conditions were far from ideal: overcast skies and rain forced high ISO settings and produced noisy images, and water running down the face caused reflections. Construction joints were not drawn, and the wet surface made it impossible to draw conclusions about possible leaks.
A reference for the following campaigns
The number of cracks recorded rises steeply with resolution: at 0.5 mm per pixel, two to three times as many anomalies could be detected. The following campaigns kept the same resolution and the same projection surfaces, so that cracks remain comparable from one year to the next.
Delivered with the face orthophotos, elevation models, point cloud, 3D model, DWG and PDF drawings and shapefiles per family, the baseline was presented to the operator’s engineers on 2 March 2023; it has since served as the reference for the 2023, 2024 and 2025 campaigns.